The United States has been on a decade-long spending binge. Thanks to the profligate policies of both Bush and Obama, the burden of federal spending has climbed to about 25 percent of economic output, up from 18.2 percent of GDP when Bill Clinton left office.
The political class tells us that more government is good for the economy since it an “investment” and/or a “stimulus.”
The academic research, however, tells a different story. Here are some brief excerpts from a recent study by two Swedish economists, including a critically important observation about the impact of bigger government on economic performance.
…most recent studies typically find a negative correlation between total government size and economic growth. …the most convincing studies are those most recently published. …In general, research has come very close to a consensus that in rich countries there is a negative correlation between total government size and growth. It appears fair to say that an increase in total government size of ten percentage points in tax revenue or expenditure as a share of GDP is on average associated with an annual lower growth rate of between one-half and one percentage point.
Let’s focus on the last sentence of the excerpt and contemplate the implications. The research cited above tells us that annual growth is 0.5 percentage point-1.0 percentage point lower if the burden of government rises by 10 percentage points of GDP. Well, the burden of federal spending has jumped by more than 5 percentage points of GDP during the Bush-Obama years, indicating that annual growth in America is now 0.25 percentage point-0.5 percentage point lower than it otherwise would be.
Now let’s take the best-case scenario, and assume that annual growth has only dropped by 0.25 percentage points, and consider what that means. It may not sound like much, but even small differences in growth rates become very important over time. For an average household over a 25-year period, the loss of 0.25 percentage points of growth means annual income will rise, but the total increase will be about $5,000 smaller by the 25th year.
The budgetary implications of growth also are rather important. According to the Congressional Budget Office, the economy’s performance has a large impact on tax receipts (more growth means higher incomes and more taxpayers) and a small effect on government spending (more growth means fewer people at the public trough). CBO even publishes a “sensitivity table” with specific estimates (Table B-1).
If we once again use the best-case scenario and assume the Bush-Obama spending binge has reduced annual growth by only 0.25 percentage points, the CBO numbers show this means more than $750 billion of additional red ink. This is something to keep in mind as the White House argues that job-killing class-warfare tax hikes will somehow  improve the budget situation.
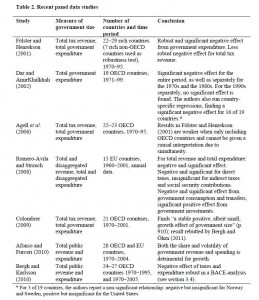
Let’s now return to the academic research. The authors included a very helpful table showing the results of recent studies on the relationship between the size of government and economic performance. Click on the image for a full-size look at how the majority of scholarly research this century confirms that big government is bad for prosperity.
For all intents and purposes, all this research shows that developed nations are on the downward-sloping portion of the Rahn Curve. Named after my Cato colleague Richard Rahn and explained in the video below, the Rahn Curve is sort of a spending version of the Laffer Curve.
It shows that growth is maximized by small governments that focus on core “public goods” like rule of law and protection of property rights. But when governments expand beyond a certain growth-maximizing level (the research says about 20 percent of GDP, by I explain in the video why the right number is probably much smaller), the result is slower growth and less prosperity.
With the exception of high-growth Hong Kong and Singapore, all developed nation have public sectors that consume at least 30 percent of economic output. This means that government spending is undermining prosperity all around the world. And since the burden of government spending is close to 40 percent of GDP in the United States…well, you can fill in the blanks.


