I worry about public policy in the United States. It’s gotten worse in recent decades and I worry it will get worse in the future.
But there are not many better alternatives. A few small countries allow more economic liberty, such as Singapore and Switzerland, but most of the world is suffering from more onerous versions of statism.
And that matters because some people argue that the United States should be more like Europe. Or they seem to think the Chinese economic model is superior.
Today’s column will tell people to be careful what they wish for.
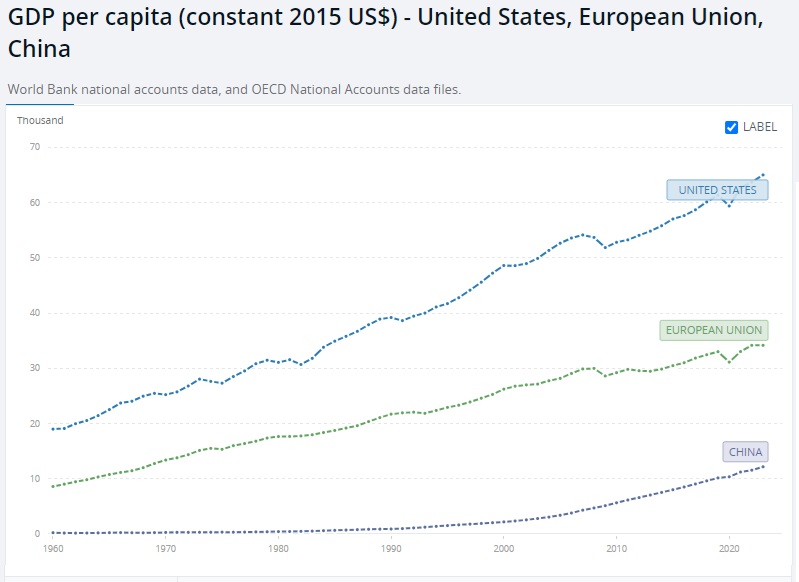
Here’s some World Bank data on per-capita economic output (gross domestic product, or GDP) in the United States, the European Union, and China.

Suffice to say, it’s not mere boosterism or misplaced patriotism to say that the United States (with 2023 per-capita GDP of $65K) has the economic system producing the best results.
Nearly twice as high as the average for the European Union ($34K) and more than five times higher than China ($12K).
By the way, let’s add two caveats to the discussion.
First, per-capita GDP is correlated with other measures, such as per-capita income, but it’s not a perfect match. That’s why I often cite (as I did just two days ago) data on “average individual consumption. Unfortunately, that data is only available for member states of the OECD.
Second, it’s perfectly fair to point out that average economic output in the European Union is suppressed because many member countries from Eastern Europe are still trying to catch up after decades of communist enslavement.
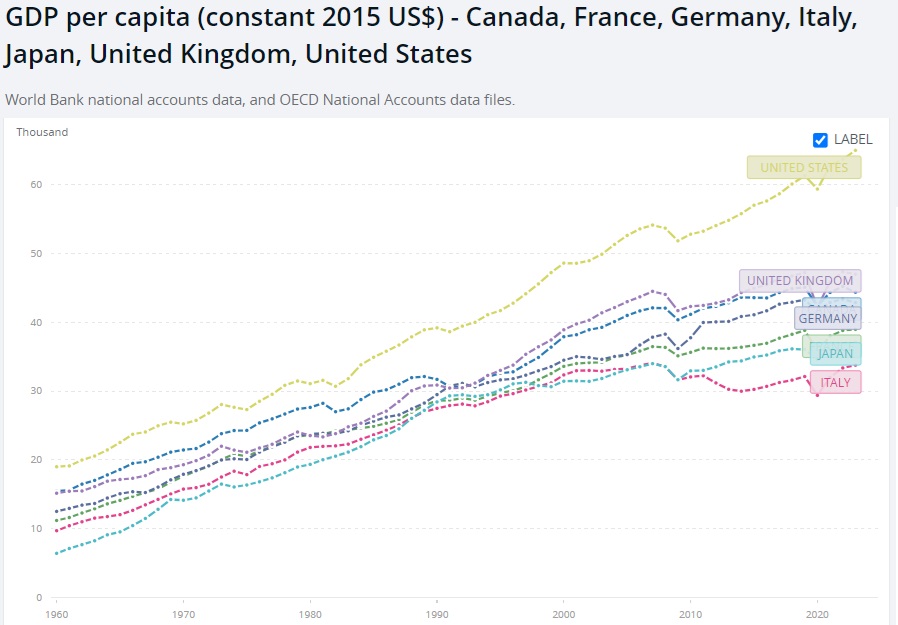
With regards to that second caveat, here are the World Bank’s per-capita GDP numbers for the “G-7” countries of the United States, Canada, Germany, France, Italy, Japan, and the United Kingdom. In other words, including the four biggest economies of Western Europe.
Still a huge lead for the United States, $18K higher than second-place United Kingdom.

The numbers for Italy are especially depressing. Basically no growth for the entire 21st century.
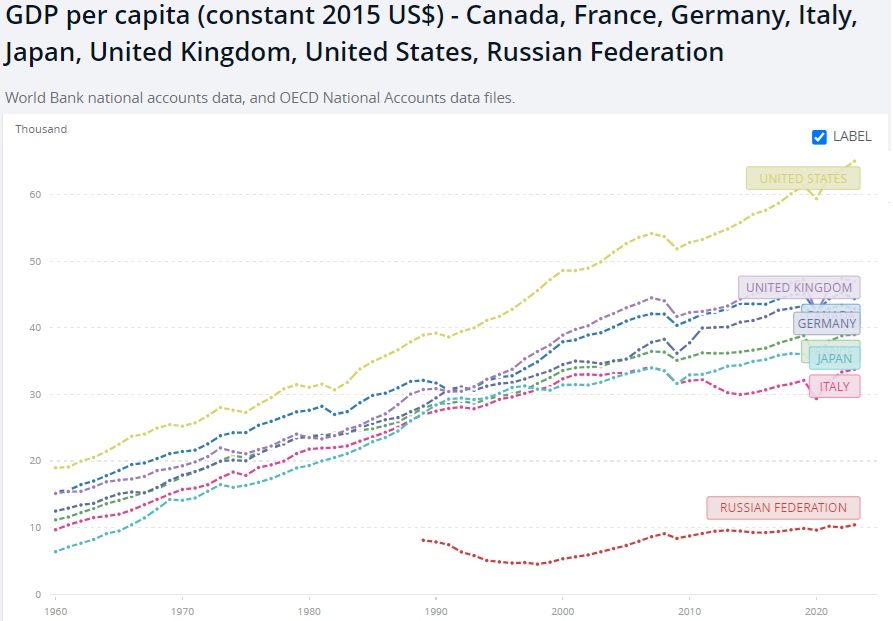
Since I’m sharing lots of data, I’ll also include the World Bank’s chart for the “G-8”, which is the term used when Russia was part of the club.
As you can see, Putin’s unfortunate subjects are even worse off than China.

The lesson from these last two charts is that there are plenty of nations that the United States should not copy.
What about the nations that are positive role models?
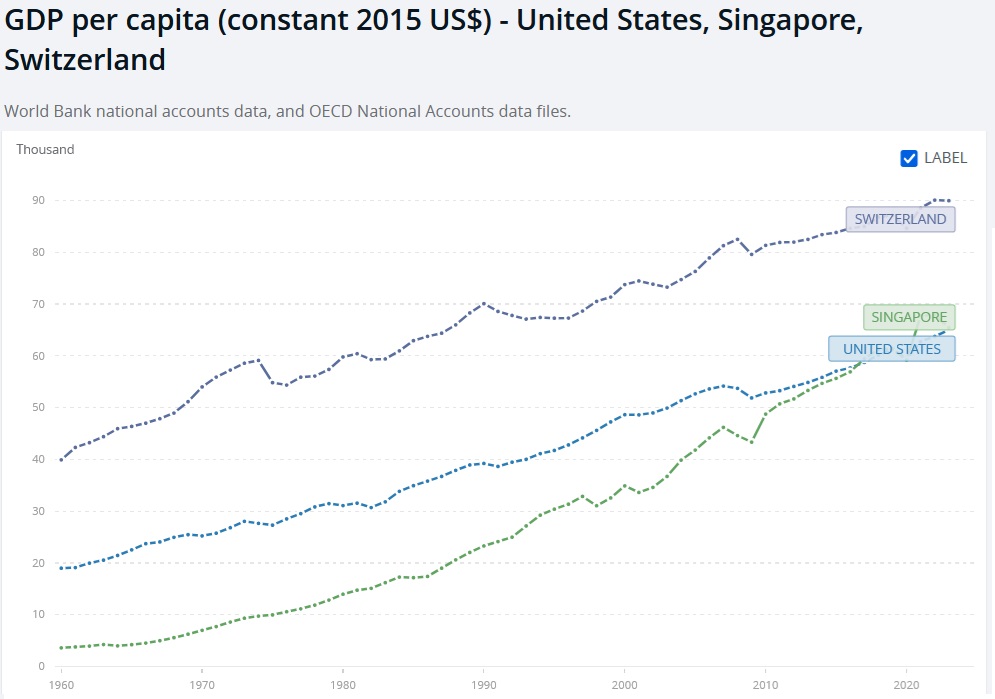
Well, here’s the World Bank chart on per-capita GDP for the United States, Singapore, and Switzerland.

I’ve previously opined about Singapore’s dramatic climb (and it looks even better using the Maddison data), and we certainly see that in the World Bank data.
I’m also a big fan of Switzerland (see here and here), though this is a case where there is a big difference between the per-capita GDP numbers and the data on average individual consumption. Switzerland is a big success by world standards, but it does not a have a big advantage over the United States.
P.S. For wonky readers who want to learn about quirks in GDP data, click here.
———
Image credit: Foreign and Commonwealth Office | CC BY 2.0.

