Obama’s main goal in the fiscal cliff negotiations is to impose a class-warfare tax hike.
He presumably thinks this will give the government more money to spend, but recent evidence from the United Kingdom suggests that he won’t get nearly as much money as he thinks.
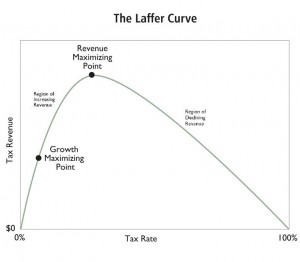
Why? Because there’s this thing called the Laffer Curve. It shows that it is naive to believe that there is a linear relationship between tax rates and tax revenue. To accurately predict what will happen to revenues when there is a change in tax policy, you also have to estimate what will happen to taxable income.
And when you’re trying to stick it to the “rich,” you need to understand that they have tremendous control over the timing, level, and composition of their income. So unlike the rest of us, they can respond very easily when the government goes after them.
The Wall Street Journal opines on what recently happened across the Atlantic.
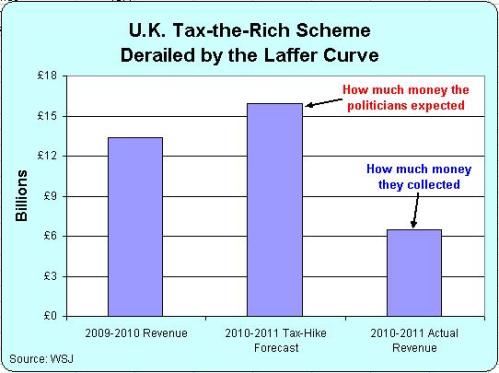
A funny thing often happens on the way to soaking the rich: They don’t stick around for the bath. Take Britain, where Her Majesty’s Revenue and Customs service reports that the number of taxpayers declaring £1 million a year in income fell by more than 60% in fiscal 2010-2011 from the year before. That was the year that millionaires became liable for the 50% income-tax rate that Gordon Brown’s government introduced in its final days in 2010, up from the previous 40% rate. Lo, the total number of millionaire tax filers plunged to 6,000 in 2010-2011, from 16,000 in 2009-2010. The new tax was meant to raise about £2.5 billion more revenue. So much for that. In 2009-2010 British millionaires contributed about £13.4 billion to the public coffers, or just under 9% of the total tax liability of all taxpayers that year. At the 50% rate, the shrunken pool yielded £6.5 billion, or about 4.4%.
In case you think this is just a special case, the United States conducted a similar experiment in the 1980s, except we lowered tax rates instead of raising them. And as you can see in this “lesson” post I wrote for the President, we got the same results as the United Kingdom, except in reverse. More rich people, more taxable income, and more tax revenue.
Here’s a chart showing what happened in the U.K. It shows tax revenue for the 2009-2010 fiscal year, followed by a projection for 2010-2011, and then the real-world numbers.
Now time for some important caveats. There are lots of things that determine taxable income for the rich, so we have no way of precisely knowing the extent to which the higher tax rate caused taxable income – and therefore tax revenue – to fall. The economy’s weak performance may have played a role, though the recession in the U.K. occurred in 2008 and 2009, so you would expect taxable income to climb for the 2010-2011 fiscal year.
It’s also possible that some of the revenue loss was the result of income shifting rather than a genuine decline in the amount of economic activity.
But we do know that the same pattern keeps appearing in nation after nation, whether we’re looking at Italy, France, or Spain. Or states such as Illinois, Oregon, Florida, Maryland, and New York.
You mess with the Laffer Curve and it will get its revenge.


