In Part I of this series, I showed that one-percentage point less annual growth over the past 100-plus years would mean the United States today would be about as poor as Mexico.
In Part II of this series, I showed that one-percentage point less annual growth over the past 100-plus years would mean the Sweden today would be about as poor as Albania.
The message in both those columns was the same: Sustained increases (or declines, in the case of pre-Milei Argentina) in economic growth magnify over time and can have an enormous impact on living standards.
For Part III, I’m going to take a slightly different approach. Instead of comparing two actual countries, we’re going to do a math experiment.
Here’s a chart from Richard Hanania. It shows what happens to average income and 10th-percentile income (poor people) when the blue-line economy grows 2 percent per year compared to the red-line economy that grows 1 percent per year.
To make the comparison especially interesting, he gives poor people a $10,000 head start in the red-line country where the economy grows only 1 percent annually.
Amazingly, by the 26th year, the poor people in the blue-line country wind up being better off, even though they started out with $10,000 less income.
Here’s some of Hanania’s analysis (Country A = blue lines and Country B = red lines).
At the tenth percentile of income, assume a person in A makes 35% of the average, or $35,000 a year. In Country B, because it engages in more redistribution, the person at the tenth percentile makes 45% of the average income, so $45,000. …Let’s also assume that because A is more capitalist, it has faster growth. A grows at 2% a year, compared to 1% a year for B. In per capita, PPP-adjusted terms, America has grown about an extra 1% a year compared to Italy over the last three decades, so this is not unrealistic. Here’s what happens in each country to average income and income at the tenth percentile over the next fifty years… By year 26, the poor person in A ($58.6K) ends up wealthier than their counterpart in B ($58.3K). From there, the gap grows. In 50 years, the poor person in A is at $94K, compared to $74K in B.
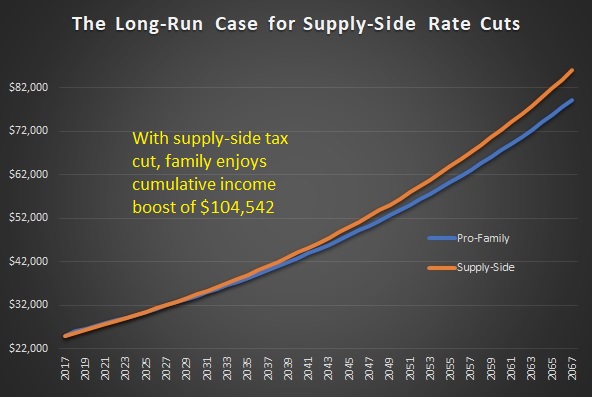
By the way, I created a similar hypothetical in Part I of my two-part series on the best tax policy for working families. My goal, expanded in Part II, was to show that lower marginal tax rates were better in the long run than child credits.
And my analysis was based on a comparatively small increase in sustained growth (just 2/10ths of 1 percent annually).
My goal (and Hanania’s goal) is to convince people that growth is the best way to help the less fortunate in societies.
Admittedly, his column (just like my first column on tax policy for working families) is merely a math exercise.
The next step, assuming people understand the math, is to then convince them that some economic policies are more like to produce sustained increases in growth. Which means boosting productivity, as Paul Krugman correctly has explained.
That’s the purpose of my Anti-Convergence Club, which contains dozens of real-world examples showing how market-based economies improve productivity and easily out-perform statism-based economies.
Heck, even the World Bank agrees with that conclusion.