Let’s augment that analysis by digging into some details.
I decided to address the issue today after seeing a tweet with this helpful summary of how different taxes cause different levels of economic damage (the Tax Foundation also has a table that ranks different taxes, and the results are similar).
The insight that some taxes are more harmful than others should not be controversial. Indeed, if you don’t have time to read all of today’s column, a simple rule of thumb is that class-warfare taxes do the most damage.
Not because of who is being taxed, but rather because it is very short-sighted to impose high marginal tax rates on work, saving, investment, and entrepreneurship.
That’s how you cause the most damage per dollar raised (and with such taxes, the amount of tax revenue often winds up being very meager because of the Laffer Curve).
But it’s just the type of tax that matters. The level of taxation is also important.
So let’s look at some excerpts from research published earlier this year by Jack Salmon of the Mercatus Center. He starts with an overview of how economists look at the issue.
…the tax multiplier measures the effect of changes in taxes on the nation’s economic output, or gross domestic product (GDP). A multiplier of -1 means that every $1 increase in the tax burden reduces GDP by an equal amount ($1). A multiplier of -1.5 means that every $1 increase in the tax burden reduces GDP by a larger amount ($1.50). …As Valerie Ramey notes in her 2019 study: “Many estimates of tax multipliers start out low on impact but then build.” …This is because it takes time for households and firms to fully react to tax changes that amplify the effects over time. …Researchers have used various approaches, from time-series statistical models to narrative historical analyses, to estimate how changes in taxes affect GDP. Estimates of the tax multiplier have varied widely, ranging roughly from -0.5 to -5 depending on the method and context.
He then shares many examples of recent academic research.
Here are some of those findings.
Blanchard and Perotti (2002)…find an impact multiplier of -0.7 and a peak multiplier of -1.33 for U.S. data over the period 1947 to 1997.
Revisiting the issue of the growth impact of taxation, Perotti (2005)…finds an impact multiplier of -0.43 and a long-run effect of -2.11.
Mountford and Uhlig (2009) find an impact multiplier of -0.28 and a peak multiplier of -3.57 in U.S. data for the years 1955 to 2000. When estimating the present value peak multiplier, they find a more significant impact of -4.98.
Uhlig (2010) uses a dynamic stochastic general equilibrium (DSGE) model (based on the Trabandt–Uhlig model) to derive a long-run tax multiplier of -2.4.
Romer and Romer (2010)…Using U.S. data for the years 1947 to 2007, the authors find an impact multiplier around -1.2 and a peak multiplier around -3.
United Kingdom (U.K.) data for the years 1947 to 2009, Cloyne (2013) finds an impact multiplier of -0.6 and a long-run multiplier of -2.46.
…for a sample of 17 OECD countries, Guajardo et al. (2014) find a larger impact on GDP of about -3.1 at the two-year horizon.
…for Germany during the period 1974 to 2010, Hayo and Uhl (2014) find an impact multiplier around -1 and a peak multiplier of -2.4.
Jones and Olson find a peak multiplier of -1.2 under a tight monetary regime and -4.3 under a loose (accommodative) monetary regime.
Mertens and Ravn (2014) adopt an SVAR approach with Romer–Romer shocks and find an impact multiplier of -1 and peak multiplier of -3.
Jalil (2016) finds an impact multiplier of -1.22 and peak multiplier of -3.89
…for a panel of 16 OECD countries, Alesina et al. (2018) find a peak multiplier of -1.5 using static surplus and -3.7 using the actual response of surplus.
…a sample of 51 countries over the period 1970 to 2014, Gunter et al. (2021) estimate impact and peak multipliers of -1.1 and -2.7, respectively. When narrowing the scope of countries to only advanced economies, the authors find the peak multiplier to be significantly larger, at -3.6.
Dabla-Norris and Lima (2023) find an impact multiplier of -1.26 and peak multiplier of -2.12 for 10 OECD countries during the period 1978 to 2014.
…for a large sample of 177 countries from 1995 to 2019, Geli and Moura (2023) find impact and long-term multipliers of -1.71 and -2.47, respectively.
Salmon then draws the obvious conclusion from all this research.
…most empirical literature suggest that tax increases are associated with a significant, negative, and persistent impact on economic growth. My preferred estimates suggest that in the short term, output falls by about 75 cents for every $1 increase in tax, while the full economic impact is likely to be around $2 for every $1 in additional taxation.
Needless to say, I don’t want to destroy private economic output so that politicians have more money to waste.
For readers who want more information about the structure (rather than level) of taxation, the Tax Foundation ranks both OECD nations and American states based on how damaging their tax systems are on a per-dollar-raised basis (or euro, or whatever).
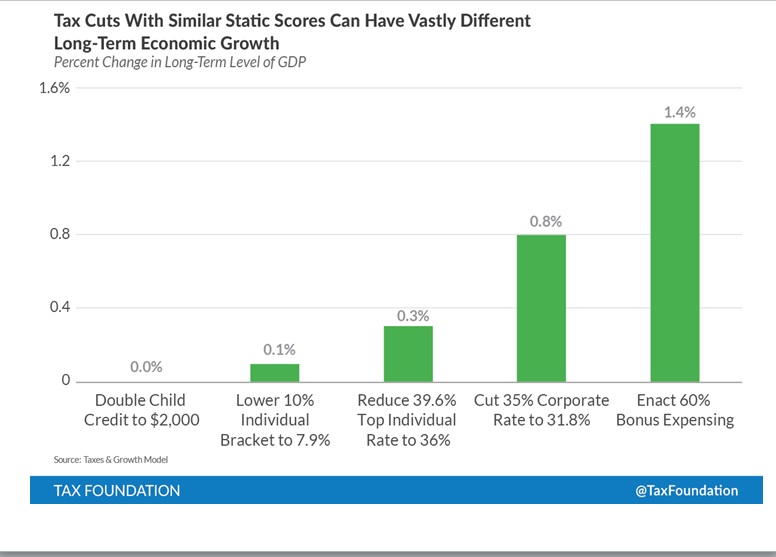
And the Tax Foundation also produced a graphic back in 2016 showing how different tax policy changes can have dramatically different effects on economic growth.