
The Case Against Foreign Aid
By Daniel J. Mitchell
The main argument in favor of foreign aid is that rich countries should help poor countries become more prosperous. Yes, some aid is strictly humanitarian, such as when there is a famine, war, or natural disaster. But most arguments for foreign aid are based on the theory that donor nations can jump-start growth in the developing world with smartly targeted aid.
In some cases, advocates of foreign aid make macroeconomic arguments, such as the Keynesian theory that dumping money into a poor country will cause more aggregate demand and thus stimulate growth. In other cases, they make microeconomic arguments. For instance, spending on infrastructure, education, or health will have a positive rate-of-return and thus improve productive capacity. There’s also the institutional case for growth, which is based on the idea aid can improve the quality of governance (better rule of law, for instance).
Advocates of foreign aid, particularly at international bureaucracies, assert that rich countries should allocate 0.7 percent of economic output (gross domestic product) to programs for developing nations.[1] The United Nations, meanwhile, specifies 17 “sustainable development goals” and measures whether donor countries are helping to achieve those targets.[2]
These targets are not being met. According to Development Initiatives, very few nations are spending 0.7 percent of GDP on foreign aid (just Sweden, Norway, Luxembourg, Denmark, and the Netherlands). The United States only spends 0.2 percent of GDP.[3] Meanwhile, the latest report from the United Nation’s Economic and Social Council shows that developing nations are regressing rather than progressing in meeting the 17 goals.[4]
Skeptics of aid are not surprised by these dour results. They explain that foreign aid is not successful and that increasing aid budgets would be throwing good money after bad. They argue that foreign aid is wrong in theory since it focuses on giving money to governments rather than the policy reforms that would boost growth. And they argue that foreign aid has failed the real-world test since countries receiving large transfers have not climbed out of poverty. Here are some citations that summarize the problem.
- A Clinton administration task force conceded that “despite decades of foreign assistance, most of Africa and parts of Latin America, Asia, and the Middle East are economically worse off today than they were 20 years ago.”
- Development economist Peter Thomas Bauer, citing an unnamed Dutch politician, observed that “foreign aid is a system by which poor people in rich countries subsidize rich people in poor countries.”[5]
- In 1989, a bipartisan task force of the House Foreign Affairs Committee concluded that U.S. aid programs “no longer either advance U.S. interests abroad or promote economic development.”
- A 1998 World Bank report concluded that aid agencies “saw themselves as being primarily in the business of dishing out money, so it is not surprising that much [aid] went into poorly managed economies with little result.”
- Nobel laureate in economics Angus Deaton notes “Large inflows of foreign aid change local politics for the worse and undercut the institutions needed to foster long-run growth.”[6]
- The World Bank has conceded, “Reform is more likely to be preceded by a decline in aid than an increase in aid.”
- Former World Bank economist William Easterly, current professor at New York University, noted that, “…aid alone cannot achieve the end of poverty. Only homegrown development based on the dynamism of individuals and firms in free markets can do that.”
This report will analyze foreign aid and ask whether it has been effective. It will investigate aid from a global perspective, but also include analysis of American aid patterns. Finally, the report will conclude by looking at Moldova as a case study.
Foreign Aid Is Costly, but Not Primarily a Budget Issue
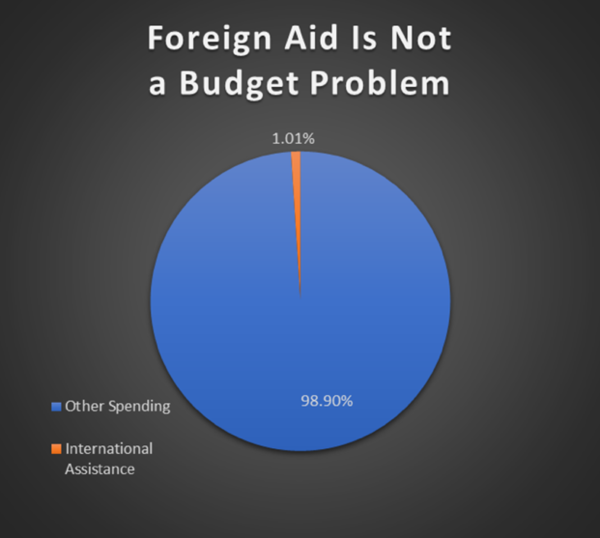
Before looking at the efficacy of aid, let us review – and downplay – the fiscal controversy. Foreign aid generates a lot of hostility, particularly from people concerned about wasteful spending. But such spending is not a major cause of budgetary problems. In the United States, for instance, total foreign aid this year is about $70 billion, which is barely 1 percent of the overall federal budget.[7] And that figure includes administrative costs, meaning that the amount of money actually transferred to foreign governments is significantly smaller (only $36 billion went for conventional foreign aid, while about $20 billion was allocated for “security assistance”).
Some donor governments spend more than the United States, either measured as a share of their budgets or as a share of economic output. Other donor governments spend less.[8] Compared to other expenditures, particularly entitlements such as pensions and health care, foreign aid outlays among donor nations are not significant.
Nonetheless, there is still a lot of aid money being sent around the world. Here’s a chart from a 2022 Cato Institute report showing that overall foreign aid levels have risen sharply, though aid from the United States has grown slowly.
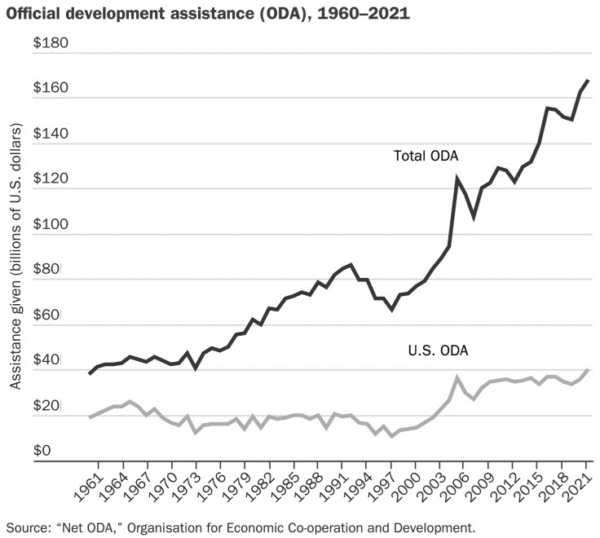
According to the latest OECD data, foreign aid for 2023 reached $223.7 billion.[9] So the upward trajectory is continuing. There are several ways of measuring which jurisdictions receive the most aid. On a per-capita basis, small island nations get the most money.[10] In terms of raw dollars from all donor nations since 1960, here are the nations that have received the biggest handouts.
| Jordan | $53,959,219,722.75 |
| Mozambique | $56,247,289,984.86 |
| Kenya | $58,265,190,067.29 |
| Viet Nam | $63,779,910,316.47 |
| Nigeria | $64,345,159,980.77 |
| Congo, Dem. Rep. | $67,388,739,433.29 |
| Tanzania | $70,935,189,759.25 |
| Pakistan | $74,447,530,288.70 |
| Bangladesh | $83,022,729,887.96 |
| Ethiopia | $86,641,469,818.12 |
| Iraq | $88,308,539,945.30 |
| Afghanistan | $92,416,030,431.27 |
| Syrian Arab Republic | $103,034,010,464.19 |
| India | $108,067,419,982.91 |
| Egypt, Arab Rep. | $110,001,919,679.64 |
And here’s a look at which nations got the most aid from American taxpayers in 2024.[11]
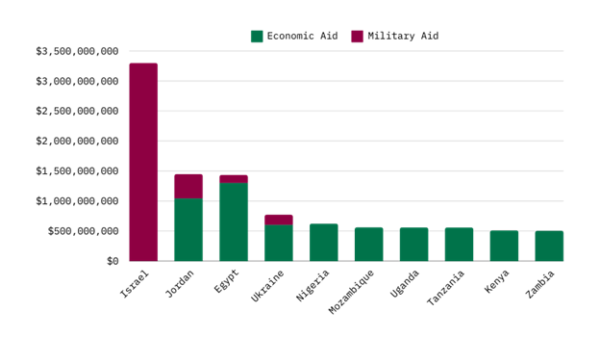
Much of global aid and most of U.S. aid goes to the Middle East in hopes of buying peace. At the risk of understatement, that approach has not been very successful. Looking at the bigger picture, the question is whether any foreign aid spending passes a cost-benefit test. That presumably matters just as much – if not more – than the cost to taxpayers.
Foreign Aid: Looking at Real-World Evidence
Is all that aid money producing results? There is no evidence that foreign aid has ever turned a poor country into a rich country. Indeed, it is much more likely that foreign aid undermines economic development by giving politicians in recipient nations an excuse to delay or avoid needed reforms.
Let’s look at some evidence, and we’ll start with a chart that is sometimes cited by proponents of foreign aid. Here’s data from the International Monetary Fund showing the share of world GDP in “advanced economies” and “emerging market and developing economies.”[12] Over the past four-plus decades, the positions have flipped. The non-rich nations now account for more than 59 percent of global economic output today compared to about 37 percent of global GDP in 1980. This, we are told, is evidence that foreign aid money has produced good results.
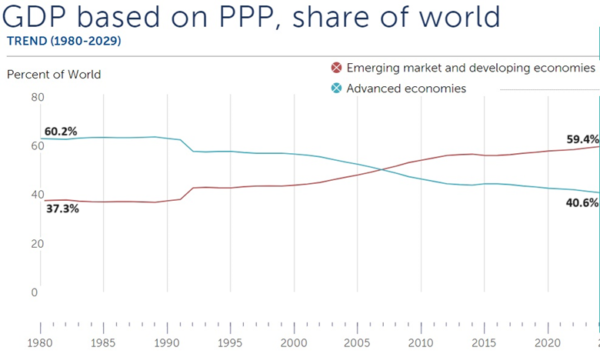
Since it would be nice to learn that foreign aid spending is producing good outcomes, these IMF numbers are superficially encouraging. However, there are several problems with that assertion.
- No evidence is ever offered to show that foreign aid caused the relative shift in global GDP, merely an expression of hope that such spending somehow made a difference.
- The GDP numbers are not adjusted for population, which is a grotesque methodological flaw since the vast majority of global population growth has been in emerging and developing nations.[13]
- There are alternative explanations such as convergence theory, which predicts that poor countries naturally should catch up to rich countries since capital owners will seek to benefit from lower wage levels is less-developed nations.[14]
There’s another reason to doubt the assertion that foreign aid has had a positive effect. It turns out that just two nations, China and India, are responsible for the entire shift in global GDP. China now accounts for 19 percent of overall economic output, up from just 2.26 percent of GDP in 1980.
Yet both nations have seen big increases in population, particularly India, so it would be more useful to look at what has happened to their per-capita GDP. And that should be followed by an examination of whether any improvement is because of aid.
Here’s a chart, based on the Maddison database, that compared the United States, China, and India. The good news is that China and India have finally begun to enjoy some growth. But the bad news is that they have not come close to narrowing the gap with the United States. Indeed, India is losing ground to America.
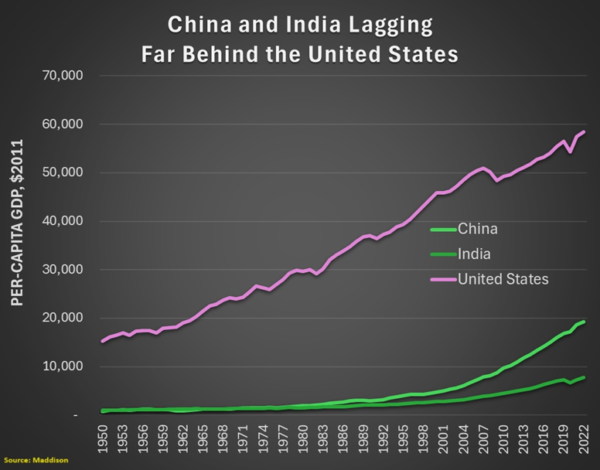
China is far behind the United States, though at least there are some signs of convergence. That being said, is there any reason to believe foreign aid played a role? The answer is no. China’s growth spurt took place after China abandoned the doctrinaire communism that characterized the Mao years. It was only after China engaged in partial economic liberalization – especially regarding trade – that economic performance improved.
Now let’s look at specific examples of nations that are major recipients of aid, either measured in dollars or measured in transfers as a share of GDP. The World Bank has a comprehensive database showing how much foreign aid various jurisdictions have received since 1960.[15] If government-to-government transfers were good for prosperity, the nations that have received the most aid should show very strong results.
Here are the 20 jurisdictions that have received the largest amounts of aid over the past 60-plus years. The middle column shows the amount of aid received and the column on the right shows the current ranking for per-capita economic output. The results are damning. Every one of the top 20 aid recipients is in the bottom half of the world. In most cases, the big aid recipients are in the bottom 10 percent or bottom 20 percent of the world.
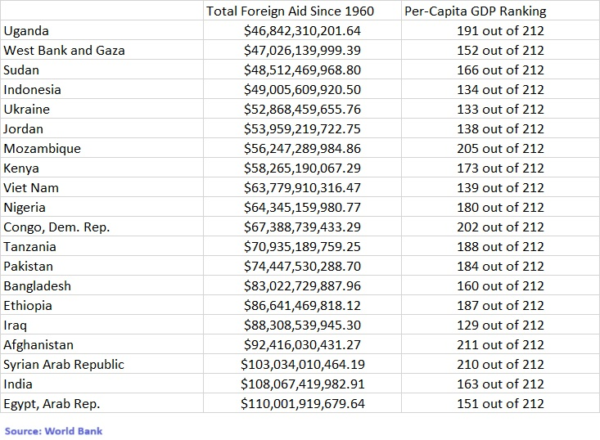
Some of these nations suffer from political instability or military conflict, so it would be a big exaggeration to claim in some instances that foreign aid is the cause of a jurisdiction’s poverty. Moreover, these numbers are not adjusted for population. So even though India has received about twice as much aid as Mozambique over the past six decades, it has a population of more than 1.4 billion, dwarfing Mozambique’s 35 million.
That being said, adjusting aid numbers for population does not change the conclusion. Nations that receive lots of aid have dismal economic outcomes. The appendix shows foreign aid receipts for every country. No jurisdiction with substantial aid can be considered an economic success.
What Is the Recipe for Fast-Growth Economies?
Since foreign aid is not a recipe for prosperity, the follow-up inquiry is to examine the policies that do lead to fast growth. The scholars at the Fraser Institute publish Economic Freedom of the World every year.[16] That report measures the burden of government and assigns each nation a score for economic liberty. As illustrated by this chart, the rankings in the report track closely with national prosperity.
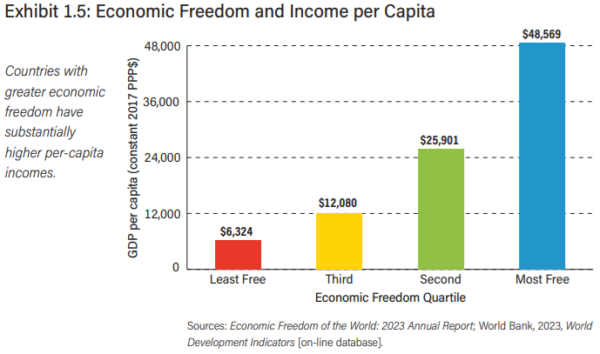
Correlation does not necessarily mean causation, of course, which is why Fraser has a lengthy report demonstrating the empirical link between good policy and national prosperity.[17]
But let’s also look at some real-world evidence. This section will examine nations that have become rich, at least by regional standards, and investigate whether foreign aid played a role. At the risk of oversimplifying, we’ll look at four types of nations – and the first three types are not very relevant for a discussion about foreign aid.
Western countries
In the 1800s and early 1900s, nations in Western and Northern Europe, as well as some North American and Pacific Rim nations settled by Europeans, became rich. But none of these nations received foreign aid, so they must have become rich for other reasons.[18] The strongest explanation is that mass prosperity arose during the era when capitalism evolved. As these nations embraced rule of law and limited government, living standards dramatically increased.
Oil Sheikdoms
In more modern times (post-World War II), some nations such as Qatar, United Arab Emirates, and Kuwait became relatively rich because of natural resources. More specifically, a few jurisdictions with limited populations and large hydrocarbon reserves now have high levels of per-capita GDP (though it is likely that the real wealth is narrowly controlled by government elites). In any event, the good luck of sitting on massive energy reserves cannot be replicated – especially by giving aid.
Tax Havens
The “offshore world” is another example of how a few places with small populations became rich. But instead of having the good luck of sitting on oil, they became “tax havens” specializing in financial services. Such policies can be copied, but the places that got in the business first (Cayman Islands, Monaco, Bermuda, Liechtenstein, etc) have a permanent advantage. Moreover, low-tax jurisdictions are now under permanent attack by international bureaucracies representing the interests of high-tax nations, so it is very doubtful that offering non-resident financial services would be a successful route for prosperity today. And there is zero possibility that donor nations would give aid to enable more tax havens.
Modern-Day Success Stories
Having looked at historical examples and special cases, let’s now look at nations in the post-World War II era that have made the jump from lower-income to upper-income status. The focus of this section will be places that had no obvious advantages (energy, financial services), yet have managed to enjoy rapid sustained growth and become rich, particularly by regional standards.
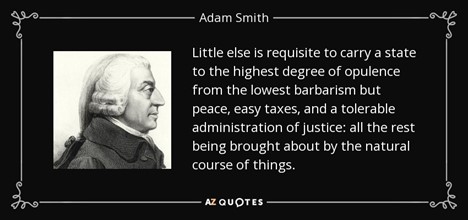
One thing these jurisdictions have in common is that they follow Adam Smith’s advice. Notice that Smith isn’t asserting that there should be no taxes. Or perfect administration of justice. He simply points out that prosperity is not that difficult to achieve if governments keep their depredations under control.
We’ll start by reviewing the experience of the Asian Tigers. This is the region of the world routinely cited for producing growth miracles. And as can be seen on this chart, there are some remarkable results. Singapore, for instance, is now one of the world’s richest countries (and is considerably richer than the United States). Hong Kong also has been a very impressive story, though the economy in recent years has stagnated because of the Chinese takeover and concerns about the future of economic liberty.
What’s noteworthy about both Singapore and Hong Kong is that they have received almost no aid. Indeed, both jurisdictions have received well under $1 billion over the past 60 years (Taiwan also is an amazing success story, but the World Bank does not have or does not share data about aid disbursements).
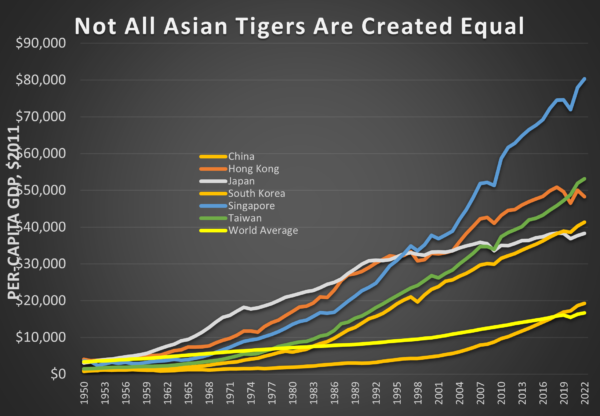
There is data for South Korea. According to the World Bank, it has been given $4.1 billion in aid over the past six-plus decades. Do those disbursements deserve credit for South Korea’s growth? Well, North Korea, with only half the population, has received $3.2 billion (a much greater amount when looking at aid on a per-capita basis). And that nation remains mired in grinding poverty (South Korea has 25 times as much per-capita GDP).
Incidentally, the U.S. Agency for International Development claims that South Korea and Taiwan show that foreign aid can be successful. Yet a report from the Cato Institute noted that, “those countries began to take off economically only after massive U.S. aid was cut off.” [19]
Moreover, China is the worst-performing economy on the above chart. It has received more than $45 billion in aid. Given the size of China’s population, that is not actually a big amount of aid. The explanation for China’s comparatively poor economic numbers is that it has a far lower level of economic freedom than the other jurisdictions.
Let’s now look at a couple of success stories from other parts of the world. We’ll start with some bad news. Singapore is the only lower-income nation since World War II that has become a rich nation. Hong Kong, Taiwan, and South Korea also have enjoyed very strong growth, definitely earning themselves what used to be called first world status.
In other parts of the world, the best-case scenarios are not about becoming rich, but about faster-than-average growth based on regional comparisons. Let’s start by looking at Sub-Saharan Africa, which historically has been the world’s most economically disadvantaged region. But not all of the countries have the same economic profile. A few, like Equatorial Guinea, have lots of oil and definitely are not typical.
If we focus on the other nations in the region, grinding poverty is the norm. But there is one dramatic exception. Here’s a chart showing Botswana’s per-capita GDP over time compared to the average of other nations in Sub-Saharan Africa. As you can see, it was much poorer than the average country in the region when it gained independence in the mid-1960s. But what has happened since then is almost a miracle. Botswana has enjoyed significant growth while its neighbors have languished.
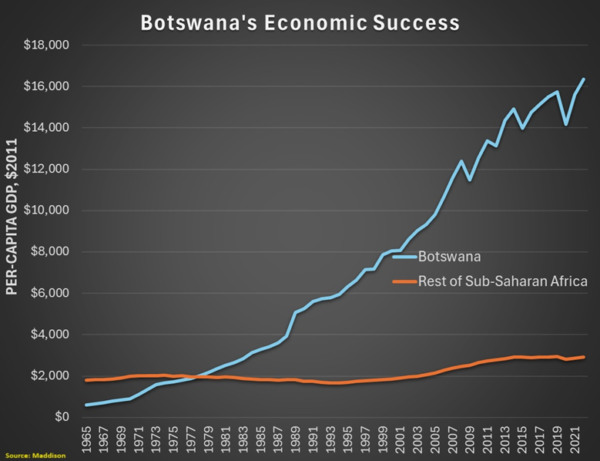
Botswana is not a rich country by world standards, but it is very prosperous by African standards. The interesting question is figuring out the factors that explain Botswana’s relative prosperity. Since the country has received more than $5 billion in aid over the past six decades and has a population today of only about 2.5 million, it is reasonable to think that aid has been a positive factor. But if you look at other African nations with small populations, they have received, on average, even more aid on a per-capita basis. Yet all those nations are still dealing with abject poverty.
The more rigorous explanation for Botswana’s relative success is that it routinely ranks at or near the top in rankings of economic freedom when compared to neighboring countries. That is true when looking at the Index of Economic Freedom.[20] And it is true when looking at Economic Freedom of the World.[21]
Incidentally, Botswana is not highly ranked for economic liberty by world standards. It lags behind most European nations, as well as the United States and other market-oriented countries. But it gets adequate scores, and that is enough to produce semi-decent results. Especially since most other nations in the region score very poorly for economic freedom and thus have predictably bad economic outcomes.
Now let’s cross the South Atlantic Ocean and see what lessons we can learn from South America. Fifty years ago, Chile was a poor country, with per-capita GDP equal to Brazil. It was far behind Venezuela, which used to be the richest nation on the continent, and also was only half as prosperous as Argentina.
But as shown in the chart, Chile has enjoyed remarkable growth and is now richer than the other three countries. Once again, let’s consider whether foreign aid deserves the credit or whether there are other factors. Chile actually has received more aid, on a per-capita basis, than the other three nations. But the amount of aid given to all four nations is small compared to per-capita aid levels to Africa.
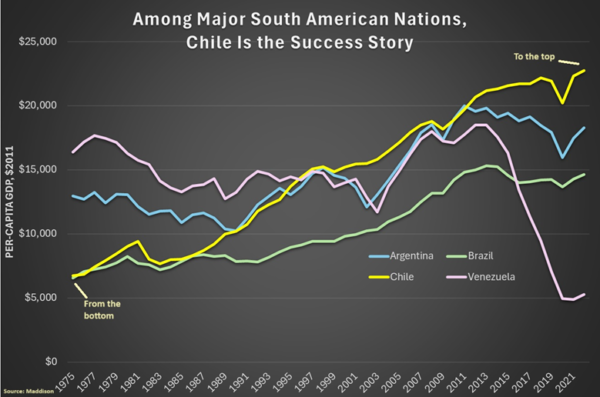
If aid levels were not a major factor, other reasons much have dominated. In the case of Venezuela, the country’s collapse almost surely is a consequence of the dictatorial socialism imposed by Presidents Chavez and Maduro. Similarly, Argentina’s stagnation can be largely attributed to Peronist dirigisme. But what accounts for the big divergence between Chile and Brazil? They used to be at the same level, but now Chile’s per-capita GDP is $8,000 higher.
The best answer is that Chile in recent decades has had much better public policy. In the 1970s, Chile and Brazil got similar scores for economic liberty.[22] But then Chile engaged in dramatic liberalization. Brazil also improved its economic policy, but not nearly as much. As a result, Chile has enjoyed much higher scores for economic liberty for several decades. And it was during this period that Chile’s economy dramatically out-performed Brazil’s economy.
To be sure, Chile is not a rich country. It’s well behind the United States and Singapore, and there’s also a measurable gap between Chile and Asian Tigers such as Taiwan and South Korea. However, Chile has been successful by regional standards and the only logical explanation is good policy rather than foreign aid.
The Case of Moldova
Having been to Moldova several times in recent years, it is a good case study to examine. Moldova is an economic laggard. It is the poorest nation in Europe other than Kosovo and war-ravaged Ukraine, with per-capita economic output lower than nations such as Libya, Ecuador, and Botswana.[23] The country has experienced very little real (inflation-adjusted) growth since breaking free from the Soviet Union about three decades ago.
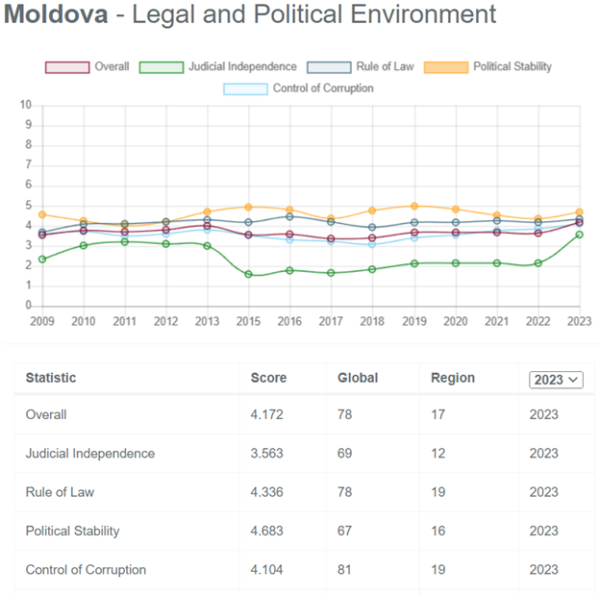
Moldova’s stagnation is in part due to poor governance. The most shocking findings are that the quality of governance has not improved since the collapse of communism. As you can see from the chart, a few indices have seen slight improvement, but those are offset by the ones that have declined.[24]
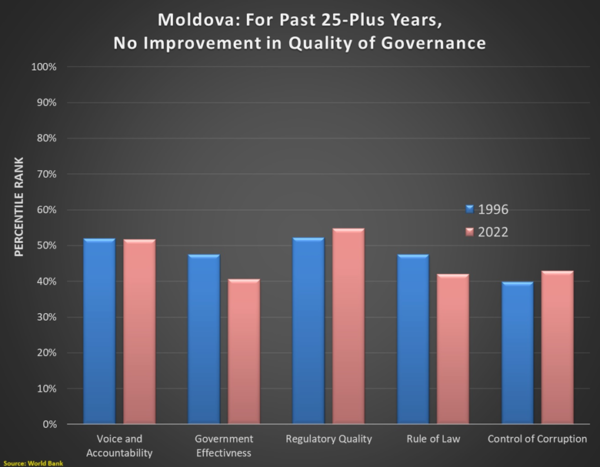
The World Bank data is not an anomaly. Here are some of the other grim numbers from other independent analysts.
- Transparency International’s Corruption Perceptions Index gives Moldova only 42/100 (76 out of 180 nations).
- The World Justice Project gives Moldova only 53/100 for rule of law (68 out of 142 nations).
- The Property Rights Alliance gives Moldova 4.7/10 for property rights (70 out of 125 nations).
The data from the Property Rights Alliance is especially depressing.[25] The data goes back to 2009 and you can see that there has been no improvement over this 14-year period.
What’s especially shocking is to see how Moldova has stagnated compared to neighboring Romania.[26] Both nations had a similar level of economic development when the Soviet empire collapsed. Since then, per-capita GDP in Romania has quintupled while the data for Moldova show very little progress.
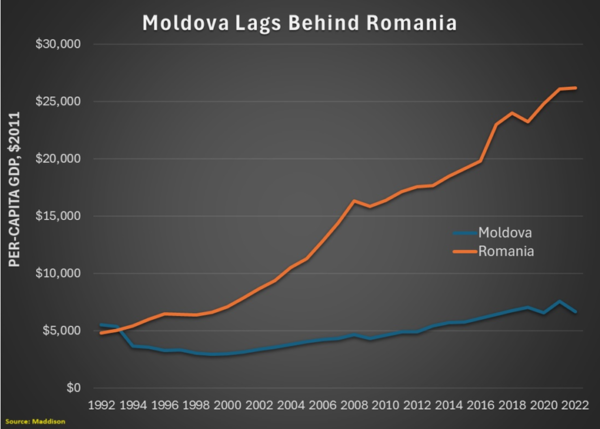
There is no reason to think that European Union membership is responsible for Romania’s comparatively strong performance. As noted in the graph, EU membership (phased in between 2004-2007) did not alter the nation’s long-run growth rate.
Since EU membership did not make a meaningful difference, what accounts for the vastly different economic outcomes in Moldova and Romania?
The answer in large part is that there are significant differences in economic policy. According to the Fraser Institute’s Economic Freedom of the World, Moldova is ranked #57 while Romania is ranked #27. Romania has big advantages in monetary policy, regulatory policy, and trade policy, along with a modest advantage for legal system and property rights (offset by Moldova’s modest advantage for size of government).[27]
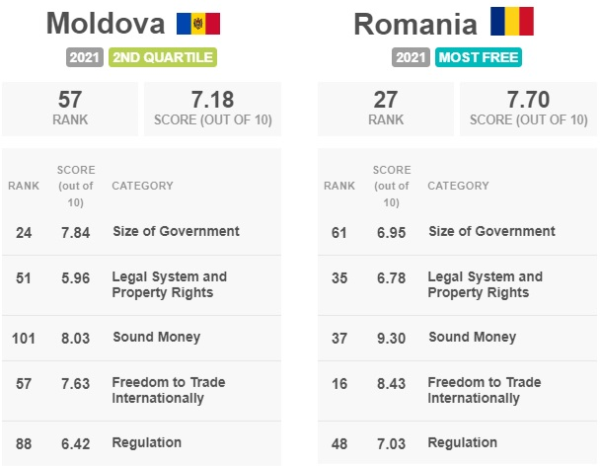
The Heritage Foundation’s Index of Economic Freedom also shows Romania with significantly better economic policy than Moldova, though both countries rank lower with Heritage than with Fraser, with Romania coming in at a mediocre #51 and Moldova trailing with a dismal #99.[28]
Now let’s bring foreign aid into the analysis. According to the World Bank data, Moldova has received more than $7.8 billion of aid over the past three decades, making it one of the world’s biggest recipients on a per-capita basis.[29] Romania, however, has only received $5.6 billion. And since Romania has 19 million people compared to 2.5 million in Moldova, per-capita handouts to Moldova have been immensely larger.
Regarding U.S. aid to Moldova, it has been averaging about $50 million per year during this century, with occasional larger spikes, such as the $246 million-plus disbursement in 2023.[30] It is worth noting that Moldova during this period has received more aid from the United States than Romania.[31]
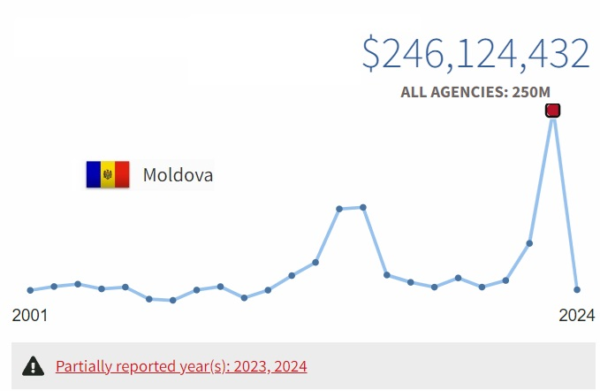
Has all that aid helped Moldova grow faster than Romania? No.
Has all that aid helped Moldova keep pace with Romania? No.
In all likelihood, the handouts to Moldova have led to less growth. Why? Because politicians have less incentive to fix problems when they can simply put their hands out for freebies.
Speaking of freebies, many governments think relying on the IMF will help, but that international bureaucracy has a poor track record. Looking at the 25 countries that have relied most heavily on the IMF, it is impossible to find a nation that can be considered an economic success story.[32]
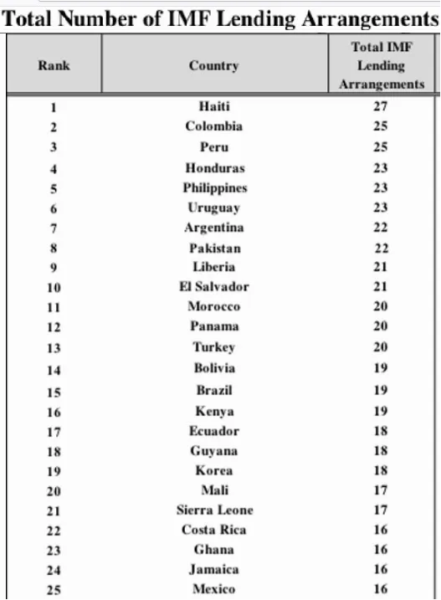
To be fair, the IMF often offers good advice on issues such as regulation and trade, but it is far too quick to embrace tax increases (perhaps because it wants revenue streams to repay IMF loans). Which may explain why so many governments get caught in a destructive borrow-tax-borrow-tax cycle.
Likewise, there is very little reason to think that growth can be boosted by getting funding from the European Union. Government-to-government transfers are not a recipe for vibrant private-sector growth.
Moldova’s economy needs disruption. It is like a ship with too many barnacles clinging to the keel. It is not deft, nimble, or adaptive. Drastic change is needed to make lives better for Moldovans.
Conclusion
In theory, government-to-government aid could play a productive role if there was conditionality. But it would have to be the right kind of conditionality (unlike IMF conditionality, which often is used to bribe nations into adopting anti-growth tax policy).
If the United States government or other aid agencies around the world made aid contingent on, say, a 1.0-point increase in Moldova’s score from Economic Freedom of the World (in other words, increasing from 7.18 to 8.18), that would result in the country having the 5th-highest level of economic freedom in the world.[33]
Or perhaps a modest goal would be more realistic, such as requiring measurable improvements in the rule of law. That might encourage the government to implement a program bringing in foreign judges as part of a fight against corruption. Heck, perhaps an aid package could finance such a reform.
Sadly, donor governments are tragically uninterested in imposing good conditions on aid. And perhaps the good type of conditionality is not feasible, as the Cato Institute has explained.[34]
What we can say, with full confidence, is that poor countries have received about $4 trillion of aid since 1960 and none of them escaped poverty as a result. Aid has been a total failure.
There are a few success stories in the post-World War II era, but they all got rich with good policy.
Hence, my “Foreign Aid Paradox.”
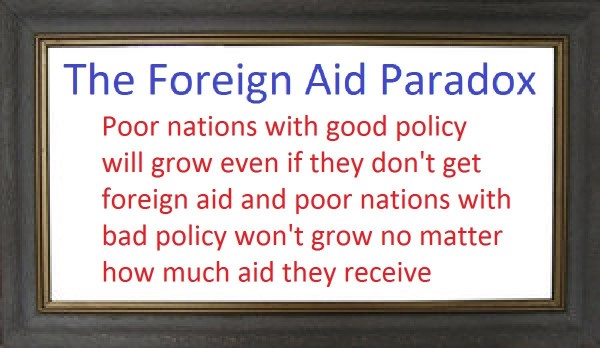
What poor nations need is to copy the only recipe – free markets and limited government – that has ever enabled poor nations to become rich nations.
- Aid is not needed to dismantle protectionism.
- Aid is not needed to reduce red tape.
- Aid is not needed to lower tax rates.
- Aid is not needed to fight inflation.
- Aid is not needed to control corruption
Sadly, there is every reason to think the next few decades of aid disbursements will be just as much of a failure as the last few decades of aid disbursements.
Appendix
| 1 | Andorra | $0.00 |
| 1 | American Samoa | $0.00 |
| 1 | Australia | $0.00 |
| 1 | Austria | $0.00 |
| 1 | Belgium | $0.00 |
| 1 | Canada | $0.00 |
| 1 | Switzerland | $0.00 |
| 1 | Channel Islands | $0.00 |
| 1 | Curacao | $0.00 |
| 1 | Germany | $0.00 |
| 1 | Denmark | $0.00 |
| 1 | Spain | $0.00 |
| 1 | Finland | $0.00 |
| 1 | France | $0.00 |
| 1 | Faroe Islands | $0.00 |
| 1 | United Kingdom | $0.00 |
| 1 | Greece | $0.00 |
| 1 | Greenland | $0.00 |
| 1 | Guam | $0.00 |
| 1 | Isle of Man | $0.00 |
| 1 | Ireland | $0.00 |
| 1 | Iceland | $0.00 |
| 1 | Italy | $0.00 |
| 1 | Japan | $0.00 |
| 1 | Liechtenstein | $0.00 |
| 1 | Luxembourg | $0.00 |
| 1 | St. Martin (French part) | $0.00 |
| 1 | Monaco | $0.00 |
| 1 | Netherlands | $0.00 |
| 1 | Norway | $0.00 |
| 1 | New Zealand | $0.00 |
| 1 | Puerto Rico | $0.00 |
| 1 | Portugal | $0.00 |
| 1 | San Marino | $0.00 |
| 1 | Sweden | $0.00 |
| 1 | Sint Maarten (Dutch part) | $0.00 |
| 1 | United States | $0.00 |
| 1 | Virgin Islands (U.S.) | $0.00 |
| 39 | Bermuda | $4,479,998.77 |
| 40 | Macao SAR, China | $14,099,999.61 |
| 41 | Cayman Islands | $22,890,000.41 |
| 42 | Brunei Darussalam | $53,690,000.09 |
| 43 | Qatar | $76,040,000.46 |
| 44 | British Virgin Islands | $104,529,998.94 |
| 45 | Bahamas, The | $110,540,000.48 |
| 46 | Kuwait | $161,949,999.40 |
| 47 | Gibraltar | $179,540,000.37 |
| 48 | United Arab Emirates | $232,900,002.14 |
| 49 | Turks and Caicos Islands | $233,880,000.44 |
| 50 | Barbados | $275,250,000.89 |
| 51 | Antigua and Barbuda | $323,560,001.56 |
| 52 | St. Kitts and Nevis | $331,020,000.60 |
| 53 | Trinidad and Tobago | $375,820,001.26 |
| 54 | Hong Kong SAR, China | $396,379,997.22 |
| 55 | Aruba | $404,520,001.17 |
| 56 | Saudi Arabia | $511,689,987.48 |
| 57 | Nauru | $611,280,000.60 |
| 58 | Singapore | $647,799,998.37 |
| 59 | Slovenia | $698,739,996.43 |
| 60 | Tuvalu | $710,220,004.85 |
| 61 | Grenada | $772,729,992.80 |
| 62 | Seychelles | $878,730,005.67 |
| 63 | Malta | $902,540,001.51 |
| 64 | St. Vincent and the Grenadines | $902,680,002.80 |
| 65 | Estonia | $970,270,005.23 |
| 66 | Turkmenistan | $987,119,997.02 |
| 67 | St. Lucia | $1,022,840,006.20 |
| 68 | Dominica | $1,047,630,004.26 |
| 69 | Latvia | $1,129,509,988.78 |
| 70 | Equatorial Guinea | $1,194,329,999.48 |
| 71 | Belize | $1,245,870,005.01 |
| 72 | Cyprus | $1,328,600,002.94 |
| 73 | Palau | $1,337,110,003.01 |
| 74 | Uruguay | $1,439,510,001.66 |
| 75 | Kiribati | $1,461,699,996.79 |
| 76 | Sao Tome and Principe | $1,725,300,009.97 |
| 77 | Lithuania | $1,847,920,018.20 |
| 78 | Maldives | $1,855,920,010.29 |
| 79 | Slovak Republic | $1,879,649,963.38 |
| 80 | Montenegro | $1,910,269,991.16 |
| 81 | Marshall Islands | $1,928,230,000.29 |
| 82 | Croatia | $1,997,370,013.28 |
| 83 | Tonga | $2,126,949,974.74 |
| 84 | Panama | $2,305,860,031.13 |
| 85 | Comoros | $2,534,599,994.66 |
| 86 | Samoa | $2,587,400,013.88 |
| 87 | Northern Mariana Islands | $2,756,389,975.67 |
| 88 | Suriname | $2,840,539,999.96 |
| 89 | Eswatini | $2,879,959,987.64 |
| 90 | Vanuatu | $3,010,369,991.81 |
| 91 | Belarus | $3,071,969,978.33 |
| 92 | Venezuela, RB | $3,113,879,978.24 |
| 93 | Micronesia, Fed. Sts. | $3,174,070,013.02 |
| 94 | Korea, Dem. People’s Rep. | $3,190,969,984.05 |
| 95 | Mauritius | $3,220,150,001.29 |
| 96 | Bhutan | $3,231,119,982.85 |
| 97 | Czechia | $3,231,639,984.13 |
| 98 | Hungary | $3,279,049,964.90 |
| 99 | Bahrain | $3,281,870,014.43 |
| 100 | Guyana | $3,758,019,974.23 |
| 101 | Fiji | $3,770,959,993.24 |
| 102 | Bulgaria | $3,784,400,013.92 |
| 103 | Gabon | $3,825,759,987.19 |
| 104 | Libya | $4,053,849,980.59 |
| 105 | Korea, Rep. | $4,127,200,038.91 |
| 106 | Oman | $4,197,929,977.90 |
| 107 | Paraguay | $4,230,240,026.24 |
| 108 | Eritrea | $4,491,889,997.51 |
| 109 | Kazakhstan | $4,505,339,990.62 |
| 110 | Azerbaijan | $4,546,119,987.79 |
| 111 | Gambia, The | $4,574,700,007.38 |
| 112 | Jamaica | $4,727,589,967.01 |
| 113 | Chile | $4,756,160,011.17 |
| 114 | Guinea-Bissau | $4,768,810,023.55 |
| 115 | Costa Rica | $4,844,540,024.09 |
| 116 | Malaysia | $4,888,240,019.92 |
| 117 | Argentina | $4,907,489,984.99 |
| 118 | Botswana | $5,404,770,039.32 |
| 119 | Djibouti | $5,429,270,032.41 |
| 120 | Timor-Leste | $5,479,890,010.91 |
| 121 | Solomon Islands | $5,524,459,969.16 |
| 122 | Lesotho | $5,646,989,960.67 |
| 123 | Romania | $5,647,289,993.29 |
| 124 | Cabo Verde | $5,712,850,009.63 |
| 125 | North Macedonia | $5,752,179,992.91 |
| 126 | Iran, Islamic Rep. | $5,923,229,948.88 |
| 127 | Namibia | $6,265,060,023.10 |
| 128 | Dominican Republic | $6,658,530,037.49 |
| 129 | Kosovo | $6,876,570,007.32 |
| 130 | Armenia | $7,387,329,981.57 |
| 131 | Moldova | $7,846,649,964.33 |
| 132 | Tajikistan | $8,027,700,069.43 |
| 133 | New Caledonia | $8,322,980,056.76 |
| 134 | Mongolia | $8,419,369,978.43 |
| 135 | French Polynesia | $8,701,670,000.08 |
| 136 | Cuba | $8,768,590,149.68 |
| 137 | Ecuador | $8,887,129,979.13 |
| 138 | Togo | $9,175,130,011.66 |
| 139 | Albania | $9,608,690,028.67 |
| 140 | Congo, Rep. | $10,116,730,063.16 |
| 141 | Kyrgyz Republic | $10,190,360,052.11 |
| 142 | Central African Republic | $11,247,540,042.22 |
| 143 | El Salvador | $11,284,910,078.41 |
| 144 | Angola | $11,446,479,951.24 |
| 145 | Uzbekistan | $11,643,069,910.29 |
| 146 | Guatemala | $12,159,310,071.95 |
| 147 | Lao PDR | $12,557,499,956.13 |
| 148 | Georgia | $12,780,489,977.79 |
| 149 | Mauritania | $13,181,139,923.25 |
| 150 | Algeria | $13,295,289,962.77 |
| 151 | Thailand | $13,694,650,058.75 |
| 152 | Mexico | $13,958,280,042.17 |
| 153 | Sierra Leone | $14,145,999,989.51 |
| 154 | Burundi | $14,221,510,022.64 |
| 155 | Guinea | $14,593,540,068.54 |
| 156 | Liberia | $15,099,520,037.65 |
| 157 | Chad | $15,845,569,916.75 |
| 158 | Benin | $16,667,829,938.91 |
| 159 | Peru | $17,140,029,961.82 |
| 160 | Bosnia and Herzegovina | $17,214,390,081.67 |
| 161 | Honduras | $18,082,340,024.95 |
| 162 | Brazil | $18,804,590,065.00 |
| 163 | Sri Lanka | $19,487,430,116.65 |
| 164 | South Sudan | $19,703,769,927.98 |
| 165 | Zimbabwe | $20,651,090,012.23 |
| 166 | Russian Federation | $20,854,580,001.83 |
| 167 | Cambodia | $20,962,749,966.71 |
| 168 | Papua New Guinea | $21,060,860,162.05 |
| 169 | Nicaragua | $21,144,150,137.42 |
| 170 | Tunisia | $21,877,440,139.77 |
| 171 | Poland | $21,946,500,122.07 |
| 172 | Lebanon | $23,032,949,915.89 |
| 173 | Serbia | $23,163,159,881.59 |
| 174 | Bolivia | $23,295,539,894.10 |
| 175 | Madagascar | $23,304,899,995.57 |
| 176 | Haiti | $24,436,929,867.51 |
| 177 | South Africa | $24,600,709,930.42 |
| 178 | Nepal | $25,762,310,023.31 |
| 179 | Niger | $26,757,730,024.61 |
| 180 | Colombia | $26,819,630,177.02 |
| 181 | Rwanda | $27,152,459,974.77 |
| 182 | Myanmar | $27,230,690,155.03 |
| 183 | Malawi | $28,760,610,060.69 |
| 184 | Burkina Faso | $28,980,610,100.58 |
| 185 | Cameroon | $29,390,219,813.23 |
| 186 | Philippines | $30,892,989,838.60 |
| 187 | Somalia | $32,077,629,951.48 |
| 188 | Mali | $32,353,300,020.29 |
| 189 | Senegal | $33,488,299,946.89 |
| 190 | Cote d’Ivoire | $33,608,070,089.22 |
| 191 | Israel | $34,248,340,225.22 |
| 192 | Zambia | $36,268,930,001.38 |
| 193 | Ghana | $39,128,890,167.00 |
| 194 | Turkiye | $44,825,910,092.35 |
| 195 | China | $45,554,849,725.72 |
| 196 | Morocco | $46,244,369,731.90 |
| 197 | Yemen, Rep. | $46,266,080,004.69 |
| 198 | Uganda | $46,842,310,201.64 |
| 199 | West Bank and Gaza | $47,026,139,999.39 |
| 200 | Sudan | $48,512,469,968.80 |
| 201 | Indonesia | $49,005,609,920.50 |
| 202 | Ukraine | $52,868,459,655.76 |
| 203 | Jordan | $53,959,219,722.75 |
| 204 | Mozambique | $56,247,289,984.86 |
| 205 | Kenya | $58,265,190,067.29 |
| 206 | Viet Nam | $63,779,910,316.47 |
| 207 | Nigeria | $64,345,159,980.77 |
| 208 | Congo, Dem. Rep. | $67,388,739,433.29 |
| 209 | Tanzania | $70,935,189,759.25 |
| 210 | Pakistan | $74,447,530,288.70 |
| 211 | Bangladesh | $83,022,729,887.96 |
| 212 | Ethiopia | $86,641,469,818.12 |
| 213 | Iraq | $88,308,539,945.30 |
| 214 | Afghanistan | $92,416,030,431.27 |
| 215 | Syrian Arab Republic | $103,034,010,464.19 |
| 216 | India | $108,067,419,982.91 |
| 217 | Egypt, Arab Rep. | $110,001,919,679.64 |
[1] “The 0.7% ODA/GNI target – a history,” OECD, https://web-archive.oecd.org/temp/2024-06-17/63452-the07odagnitarget-ahistory.htm and, “History of the 0.7% ODA Target,” DAC Journal 2002, Vol 3, No 4 https://web-archive.oecd.org/2019-04-25/104936-ODA-history-of-the-0-7-target.pdf
[2] “The 17 Goals | Sustainable Development.” United Nations, https://sdgs.un.org/goals
[3] “0.7% Aid Target Factsheet.” Development Initiatives, https://devinit.org/resources/0-7-aid-target-2/
[4] “Progress towards the Sustainable Development Goals,” May 2, 2024, United Nations, Report of the Secretary-General https://unstats.un.org/sdgs/files/report/2024/SG-SDG-Progress-Report-2024-advanced-unedited-version.pdf
[5] Bauer, Peter Thomas, “The case against foreign aid,” Intereconomics, Vol. 08, Iss. 5, 1973. https://www.econstor.eu/handle/10419/138832
[6] Deaton, Angus. The Great Escape: Health, Wealth, and the Origins of Inequality. Princeton, NJ: Princeton University Press, 2013.
[7] https://www.whitehouse.gov/wp-content/uploads/2024/03/hist03z2_fy2025.xlsx
[8] Most of the world’s governments are net recipients of foreign aid
[9] https://public.flourish.studio/story/2315218/
[10] Ijez, Sana, “10 Country That Receive the Most Foreign Aid Per Capita,” Insider Monkey, August 23, 2023. https://www.insidermonkey.com/blog/10-countries-that-receive-the-most-foreign-aid-per-capita-1185381/?singlepage=1
[11] “Foreign Aid by Country: Who’s Getting the Most – and How Much?” Concern Worldwide US. https://concernusa.org/news/foreign-aid-by-country/
[12] “GDP based on PPP, share of world,” IMF https://www.imf.org/external/datamapper/PPPSH@WEO/OEMDC/ADVEC/WEOWORLD
[13] “Now 8 billion and counting: Where the world’s population has grown most and why that matters,” UN Trade & Development. https://unctad.org/data-visualization/now-8-billion-and-counting-where-worlds-population-has-grown-most-and-why
[14] Mitchell, Dan, “The Economics of Convergence,” International Liberty, August 22, 2018. https://danieljmitchell.wordpress.com/2018/08/22/the-economics-of-convergence/
[15] “Net official development assistance and official aid received (current US$),” World Bank Group. https://data.worldbank.org/indicator/DT.ODA.ALLD.CD?end=2022&start=1960
[16] Gwartney, James; Lawson, Robert; Murphy, Ryan, “Economic Freedom of the World,” Fraser Institute, 2023. https://www.fraserinstitute.org/sites/default/files/economic-freedom-of-the-world-2023.pdf
[17] Block, Walter E. (Ed.), “Economic Freedom: Toward a Theory of Measurement,” Fraser Institute, 1990. https://www.fraserinstitute.org/sites/default/files/EconomicFreedomTheoryofMeasurement.pdf
[18] Some European nations exploited colonies and imposed a forcible transfer of wealth. But the two European nations most identified with that approach – Spain and Portugal – did not become rich. By contrast, some European nations became rich even though they never had colonies.
[19] Ian Vásquez, “Foreign Aid and Economic Development,” Cato Handbook for Policymakers, 2022 https://www.cato.org/cato-handbook-policymakers/cato-handbook-policymakers-9th-edition-2022/foreign-aid-economic-development
[20] “Economic Freedom Country Profile: Botswana,” Index of Economic Freedom, Heritage Foundation, Updated October 2023. https://www.heritage.org/index/pages/country-pages/botswana
[21] “Botswana,” Economic Freedom of the World: 2023 Annual Report, Fraser Institute. https://www.fraserinstitute.org/economic-freedom/map?geozone=world&countries=BWA&page=map&year=2021
[22] “Economic Freedom Score by Year(s) – World Ranking,” Economic Freedom of the World: 2023 Annual Report, Fraser Institute. https://www.fraserinstitute.org/economic-freedom/graph?geozone=world&countries=BRA,CHL&page=graph&area1=1&area2=1&area3=1&area4=1&area5=1&type=line&min-year=1970&max-year=2021
[23] “List of country by GDP (nominal) per capita,” Wikipedia. https://en.wikipedia.org/wiki/List_of_countries_by_GDP_(nominal)_per_capita
[24] Daniel Kaufmann and Aart Kraay (2023). Worldwide Governance Indicators, 2023. https://www.worldbank.org/en/publication/worldwide-governance-indicators
[25] “Moldova,” International Property Rights Index 2023, Property Rights Alliance. https://internationalpropertyrightsindex.org/country/moldova
[26] Maddison Project Database 2020. https://www.rug.nl/ggdc/historicaldevelopment/maddison/releases/maddison-project-database-2020
[27] “Romania,” Economic Freedom of the World: 2023 Annual Report, Fraser Institute. https://www.fraserinstitute.org/economic-freedom/map?geozone=world&countries=ROU&year=2021&page=map
[28] ,” Index of Economic Freedom, Heritage Foundation, Updated October 2023. https://www.heritage.org/index/pages/all-country-scores
[29] Ijaz, Sana, “25 Countries that Receive the Most Foreign Aid Per Capita,” Insider Monkey, August 23, 2023. https://www.insidermonkey.com/blog/25-countries-that-receive-the-most-foreign-aid-per-capita-1185369/
[30] “U.S. Foreign Assistance By Country – Moldova,” ForeignAssistance.gov. https://www.foreignassistance.gov/cd/moldova/2023/disbursements/0
[31] “U.S. Foreign Assistance By Country – Romania,” ForeignAssistance.gov. https://www.foreignassistance.gov/cd/romania/
[32] Hanke, Steve, “The Ever-Political IMG Meddlers Give Boris Johnson Unsolicited Advice,” Forbes, July 26, 2019. https://www.forbes.com/sites/stevehanke/2019/07/26/the-ever-political-imf-meddlers-give-boris-johnson-unsolicited-advice/
[33] “Singapore,” Economic Freedom of the World: 2023 Annual Report, Fraser Institute. https://www.fraserinstitute.org/economic-freedom/map?geozone=world&page=map&year=2021&countries=SGP#ranking
[34] “Foreign Aid and Economic Development,” Cato Handbook for Policymakers, 9th Edition, 2022. https://www.cato.org/sites/cato.org/files/2022-12/cato-handbook-9th-edition-37.pdf
———
Image credit: Oxfam East Africa | CC BY 2.0.
