I’ve previously pointed out that the so-called War on Poverty is a failure, both for poor people and for taxpayers.
My main argument is that poverty was steadily declining throughout American history, but that progress ground to a halt once politicians in Washington decided to spend trillions of dollars.
As you might expect, folks on the left have a different perspective. Or, to be more precise, they have two different perspectives.
- Some left-leaning people assert that that the post-1965 lack of progress is evidence that we need to have even more redistribution.
- But some of them instead assert that there has been a lot of progress, but not the kind that shows up in the official measure of poverty.
Today, let’s examine the second argument.
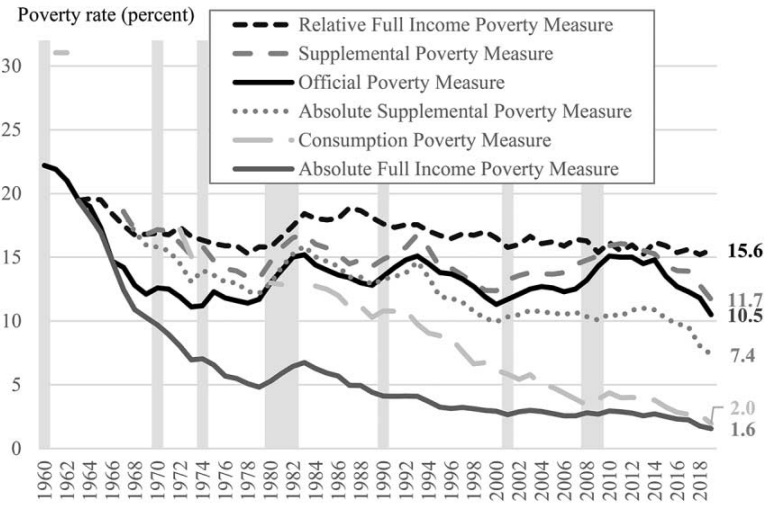
We’ll start with a chart showing many different ways to measure poverty.

The official poverty rate (“Official Poverty Measure”) comes from the Census Bureau and it gets the most attention in the media and elsewhere.
But is it the right measure, and does it show the impact of redistribution programs?
In a study published by the Journal of Political Economy, Richard V. Burkhauser, Kevin Corinth, James Elwell, and Jeff Larrimore put together a “full poverty measure” that captures the value of various handouts.
Based on their approach, there is almost no material deprivation in the United States. Their poverty rate as of 2019, shown in the above chart, was just 1.6 percent.
Here’s some of what they wrote.
Almost 60 years have passed since President Johnson declared his War on Poverty. Even so, academics and policy makers still debate its outcome. …disagreement over progress in the War on Poverty stems from disagreements over how poverty should be defined… We…create a poverty measure…which we refer to as the absolute full-income poverty measure (FPM)… We include both cash and in-kind programs designed to fight poverty, including food stamps (now the Supplemental Nutrition Assistance Program [SNAP]), the school lunch program, housing assistance, and health insurance. Finally, we hold poverty thresholds constant in inflation-adjusted terms using the Personal Consumption Expenditures (PCE) price index. Using this poverty measure, we find substantial reductions in poverty based on President Johnson’s standards. Specifically, we find that the absolute FPM poverty rate in 2019 was 1.6%, well below the official poverty rate of 10.5%.
Incidentally, the official poverty rate is now 11.5, so perhaps the authors’ FPM measure also has increased a bit.
But that’s not important for our discussion today. Instead, let’s consider whether their FPM measure shows that the War on Poverty has been a success.
The answer depends, at least in part, of whether you think government dependency is an acceptable outcome.
Here are some further excerpts from the study.
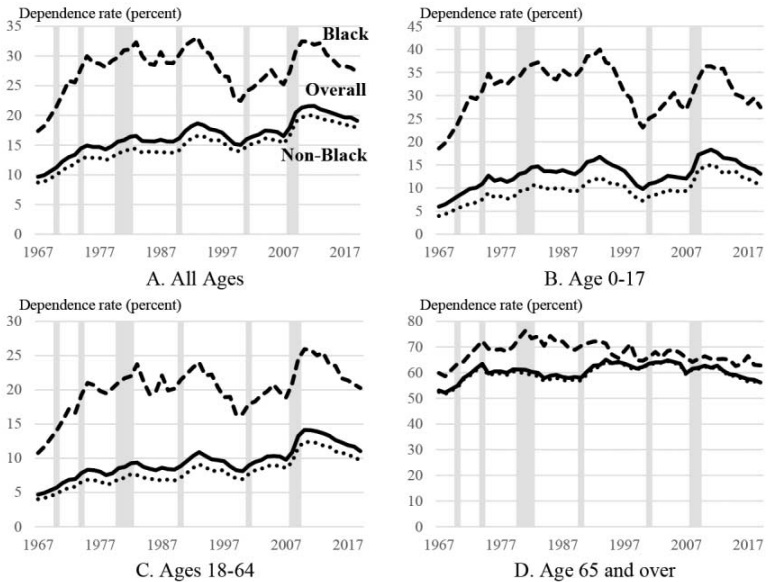
…we evaluate the extent to which poverty has fallen as a result of increases in market income versus increases in government transfers. As President Johnson further stated in his State of the Union address on January 8, 1964, “The War on Poverty is not a struggle simply to support people, to make them dependent on the generosity of others”… Contrary to this goal of President Johnson, we estimate that dependence—which we define as receiving less than half of full-income from market sources—among working-age individuals increased from 4.7% to 11.0% between 1967 and 2019. Likewise, dependence among children increased from 6.0% to 13.1%. …Success in reducing material hardship has come at the cost of having a greater share of the population dependent on government for at least half of their incomes.
Here are some charts from the JPE article, all of them showing how dependency increased for just about all groups in society.

Here’s one final excerpt, showing the difference between the right way and wrong way of reducing poverty.
…the War on Poverty…was not won by making people more self-sufficient, as President Johnson sought. Dependence (defined as receiving less than half of household income from market sources) among working-age adults and children more than doubled from 1967 to 2019. However, the rise in dependence was not uniform over the entire period, with dependence falling substantially, especially among children and non-aged Black individuals, from 1993 to 2000. This period is coincident with welfare reforms that required and encouraged work as well as a strong labor market.
This echoes my view that Bill Clinton’s welfare reform (replacing an entitlement with a block grant) was very successful and that it should be extended to other redistribution programs such as Medicaid and food stamps.
And it reinforces my view that Biden’s proposal for per-child handouts would be very harmful. The goal should be employment and self-sufficiency, not dependency and bigger government.
P.S. We can learn lessons about welfare and dependency by looking at data from Europe and Canada.


