
Federal Spending Primer, Part III: The Spending Problem is an Entitlement Problem
By Robert P. O’Quinn*
Part I of this series explained that there are different types of spending while Part II noted that the overall burden of federal spending has been expanding and will continue to grow in coming decades.
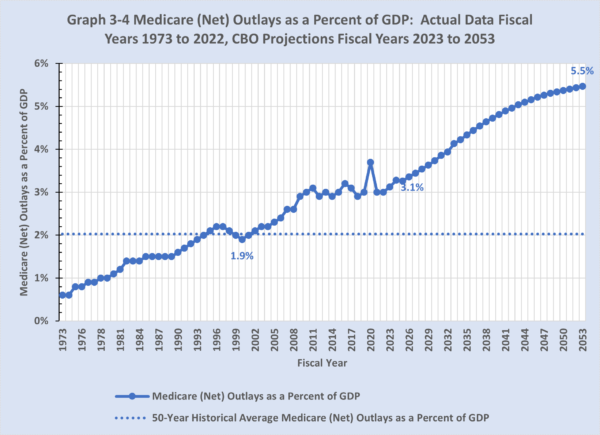
This paper, Part III in the series, shows that entitlement programs are driving federal outlays ever higher over time. Graph 3-1 compares actual data for all major categories of federal primary (non-interest) spending for fiscal year 2000 (the last fiscal year in which the federal government had a budget surplus), the current fiscal year, and the Congressional Budget Office (CBO) projections for fiscal year 2053.[1]
As shown in the chart, discretionary spending—defense, international,[2] and domestic—is not causing America’s increasing fiscal burden to mount. Instead, the problem is a subset of entitlement programs. The fiscal challenge in the United States is entirely driven by the growing burden of Social Security, Medicare, Medicaid, and other healthcare entitlements. Non-healthcare income security entitlements such as unemployment insurance, Supplemental Security Income (SSI), Supplemental Nutritional Assistance Plan (SNAP), federal civilian and military retirement benefits, non-healthcare veterans’ benefits, and agricultural subsidies are slightly declining as a share of the economy over time.
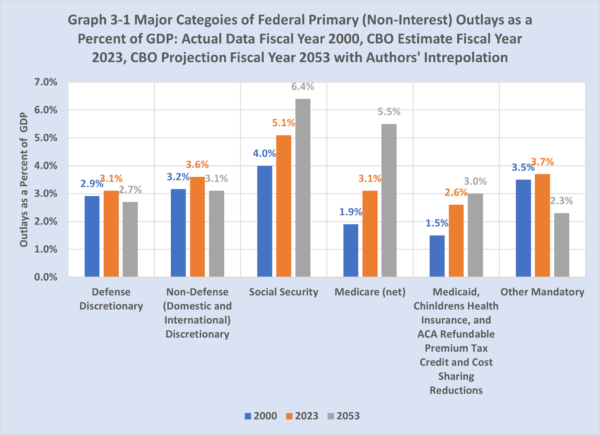
Discretionary spending.[3] As shown in Graph 3-2, total discretionary outlays were 6.1 percent of GDP in fiscal year 2000, of which defense discretionary outlays were 2.9 percent of GDP and non-defense discretionary outlays were 3.2 percent of GDP. In fiscal year 2023, CBO estimates that total discretionary outlays will be 6.6 percent of GDP, of which defense discretionary outlays will be 3.1 percent of GDP and non-defense discretionary outlays will be 3.6 percent of GDP. In fiscal year 2023, moreover, total discretionary outlays, defense discretionary outlays, and non-defense discretionary outlays will be 0.4 percentage point, 1.2 percentage points, and 0.2 percentage point below their 50-year historical averages of 8.1 percent of GDP, 4.3 percent of GDP, and 3.8 percent of GDP, respectively.
CBO projects separate defense and non-defense discretionary outlays only for the next 10 fiscal years. Thereafter, CBO projects just discretionary outlays. CBO projects that discretionary outlays will decline to 5.8 percent of GDP in fiscal year 2053, 0.3 percentage point below fiscal year 2000 and 2.3 percentage points below their 50-year historical average of 8.1 percent of GDP.[4]
While the December 2007 to June 2009 recession and the February 2020 to April 2020 recession caused temporary spikes in non-defense discretionary outlays as a percent of GDP, Graph 3-2 depicts a small decline in discretionary outlays as percent of GDP over time. Graph 3-2 shows that discretionary spending is not driving federal primary spending and federal budget deficits as a percent of GDP higher over the next 30 fiscal years.
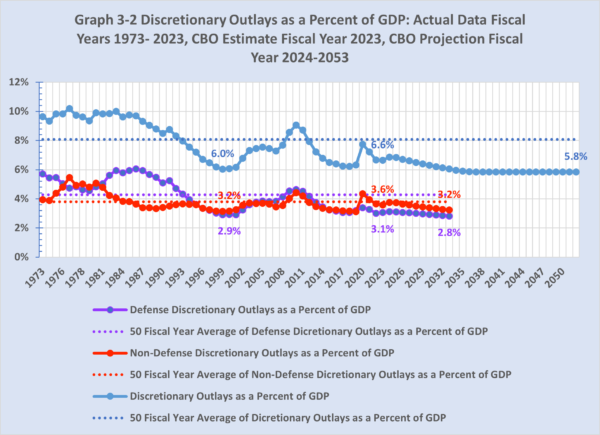
Social Security. As shown in Graph 3-3, Social Security outlays were 4.0 percent of GDP in fiscal year 2000. CBO estimates that Social Security outlays will be 5.1 percent of GDP in fiscal year 2023, 1.1 percentage points above fiscal year 2000 and 0.7 percentage point above their 50-year historical average of 4.4 percent of GDP.
CBO projects that Social Security outlays will grow to 6.4 percent of GDP in fiscal year 2053, 1.3 percentage points above fiscal year 2000 and 2.0 percentage points above their 50-year historical average. Graph 3-3 shows a steady increase over time in Social Security outlays as a percent of GDP. Social Security is the second largest contributor to higher federal primary spending and federal budget deficits as a percent of GDP over the next 30 fiscal years. CBO attributes this growth to increasing life expectancy at age 65 while the normal retirement age is fixed at 67.[5]
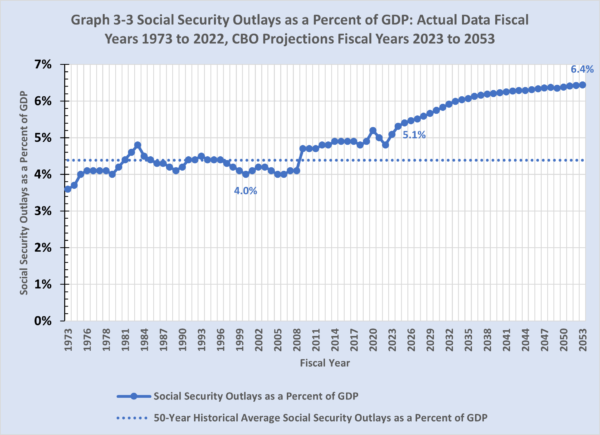
Medicare (net). As shown in Graph 3-4, Medicare (net) outlays were 1.9 percent of GDP in fiscal year 2000. In fiscal year 2023, CBO estimates that Medicare (net) outlays will be 3.1 percent of GDP, 1.2 percentage points above fiscal year 2000 and 1.1 percentage points above its 50-year historical average of 2.0 percent of GDP.
CBO projects that Medicare (net) outlays will balloon to 5.5 percent of GDP in fiscal year 2053, 2.6 percentage points above fiscal year 2000 and 2.5 percentage points above their 50-year historical average. Graph 3-4 shows a rapid increase in Medicare (net) outlays as a percent of GDP over time. Medicare is the largest contributor to higher federal primary spending and federal budget deficit as a percent of GDP over the next 30 fiscal years.
CBO attributes one-third of the increase in Medicare outlays relative to the size of the U.S. economy to increasing life expectancy and two-thirds to healthcare specific factors.[6] Longer life expectancy increases Medicare outlays because of not only an increasing number of Medicare beneficiaries but also escalating per capita healthcare costs with very old age (85 or higher). Other factors boosting healthcare entitlement outlays include: (1) the dominance of third-party payment for healthcare services that reduces the incentive of insured individuals to price shop for healthcare services, (2) regulatory barriers that limit both the supply of healthcare providers and price competition among healthcare providers, and (3) healthcare innovations that make more diseases treatable and prolong the lives of the chronically ill but often at high costs.
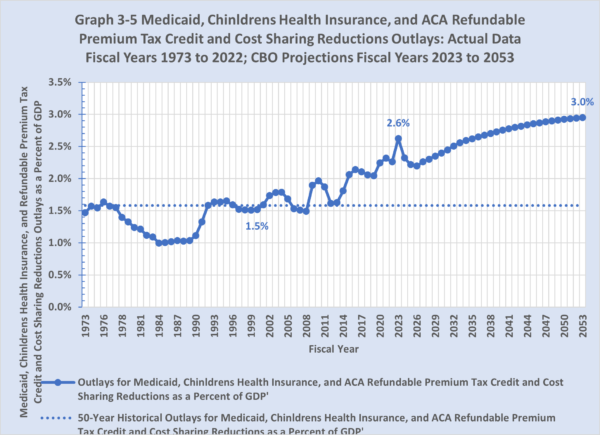
Medicaid and other Healthcare Entitlements. As shown in Graph 3-5, outlays for Medicaid and Children’s Health Insurance Program (CHIP), which was enacted as a part of the Balanced Budget Act of 1997,[7] were 1.5 percent of GDP in fiscal year 2000. The Affordable Care Act,[8] enacted in 2010, expanded Medicaid and created the Refundable Premium Tax Credit and the Cost Sharing Reductions. In fiscal year 2023, CBO estimates outlays for Medicaid, Children’s Health Insurance, and ACA Refundable Premium Tax Credit and Cost Sharing Reductions will be 2.6 percent, 1.1 percentage points above fiscal year 2000 and 1.0 percentage point above their 50-year historical average of 1.6 percent of GDP.
As seen in Graph 3-5, CBO projects that outlays for these healthcare entitlements will gradually increase to 3.0 percent of GDP in fiscal year 2053, 1.5 percentage points above fiscal year 2000 and 1.4 percentage points above their 50-year historical average. Outlays for Medicaid, Children’s Health Insurance, and Refundable Premium Tax Credit and Cost Sharing Reductions are the third largest contributor to higher federal primary spending and federal budget deficit as a percent of GDP over the next 30 fiscal years.
Medicaid and other healthcare entitlements are subject to some of the same healthcare-specific factors that affect Medicare. These include: (1) the dominance of third-party payment for healthcare services that reduces the incentive of insured individuals to price shop for healthcare services, (2) regulatory barriers that limit both the supply of healthcare providers and price competition among healthcare providers, and (3) healthcare innovations that make more diseases treatable and prolong the lives of the chronically ill but often at high costs.
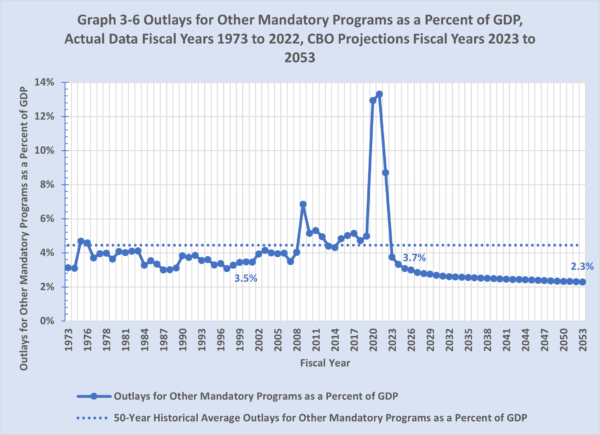
Other mandatory spending.[9] As shown in Graph 3-6, outlays for other mandatory programs were 3.5 percent of GDP in fiscal year 2000. CBO estimates the outlays for other mandatory programs will be 3.7 percent in fiscal year 2023, 0.2 percentage point above fiscal year 2000 and 0.7 percentage point below their 50-year historical average of 4.4 percent of GDP. Graph 3-7 shows that outlays for other mandatory programs have been relatively flat with a small spike during the December 2007 to June 2009 recession and a very large spike during and after the February 2020 to April 2020 recession because most pandemic relief fell into this category.
CBO envisions a decline in outlays for other mandatory programs as a percent of GDP over the next decades. In fiscal year 2053, the CBO projects outlays for other mandatory programs will decrease to 2.3 percent of GDP, 1.2 percentage points below fiscal year 2000 and 2.1 percentage points below their 50-year historical average. Thus, other mandatory programs are not contributing to higher federal primary spending and higher federal budget deficits as a percent of GDP over the next 30 fiscal years.
In summary, Social Security, Medicare, Medicaid, Children’s Health Insurance, and Refundable Premium Tax Credit and Cost Sharing Reductions are driving out-of-control growth in primary spending. In contrast, discretionary outlays are declining relative to GDP and other mandatory spending are barely changed relative to GDP.
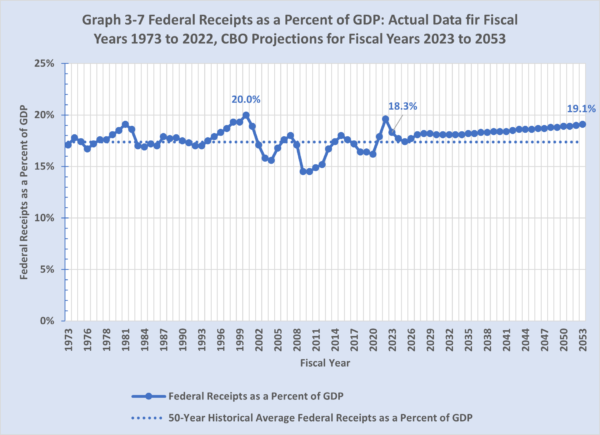
Federal receipts. As shown in Graph 3-7, federal receipts were 20.0 percent of GDP in fiscal year 2000, the highest level over the last 50 fiscal years. CBO estimates that federal receipts will be 18.3 percent of GDP in fiscal year 2023. CBO projects that federal receipts will increase to 19.1 percent of GDP in fiscal year 2053, 0.9 percentage point below fiscal year 2000 and 1.7 percentage points above their 50-year historical average of 17.4 percent of GDP. Federal budget deficits are not increasing because federal receipts are declining.
Conclusion
As a result, the federal budget deficit will balloon by 5.9 percentage points from 5.3 percent of GDP in fiscal year 2023 to 11.2 percent of GDP in fiscal year 2053. Federal debt held by the public will explode by 96.6 percentage points from 98.0 percent of GDP in fiscal year 2023 to 194.6 percent of GDP in fiscal year 2053.
If current policy remains unchanged, the federal government will spend an ever-larger share of U.S. economic output on transfer programs that benefit the elderly—Social Security and Medicare—and other medical entitlements—Medicaid, CHIP, and Premium Subsidies. In contrast, the federal government will spend slightly less as a share of U.S. economic output on other entitlements and discretionary programs. Thus, the federal budget if left on autopilot would become increasingly a vehicle to transfer income from working-age Americans to elderly Americans.
__________________________________
* Robert P. O’Quinn is the former Chief Economist at both U.S. Department of Labor and U.S. House of Representatives Committee on Ways and Means and former Executive Director at the U.S. Congress Joint Economic Committee.
[1] CBO does not provide separate projections of defense discretionary outlays and non-defense (domestic and international) discretionary outlays between fiscal years 2034 to 2053. In fiscal year 2033, CBO projects defense discretionary outlays and non-defense (domestic and international) discretionary outlays will be 2.8 percent of GDP and 3.2 percent of GDP, respectively. CBO projects discretionary outlays will gradually decline from 6.0 percent of GDP in fiscal year 2033 to 5.8 percent of GDP in fiscal year 2038 and then remain unchanged through fiscal year 2053. To construct Graph 3-1, we assume a proportional reduction as a percent of GDP in estimating defense discretionary outlays and non-defense discretionary outlays to 2.7 percent of GDP and 3.1 percent of GDP, respectively, in fiscal year 2053.
[2] International discretionary outlays have been small and very stable averaging 0.3 percent of GDP over the last 50 fiscal years and are not expected to change substantially over the next 30 fiscal years.
[3] Discretionary outlays, for which Congress makes annual appropriations, include (1) national defense, (2) international affairs, (3) domestic programs that do not involve (a) transfer payments to or on behalf of individuals or (b) federal guarantees, and (4) administrative costs of federal entitlement programs. International affairs include (1) military foreign assistance, (2) development, humanitarian foreign assistance, and (3) operating costs of Department of State.
[4] The 50-year historical average covers fiscal year 1973 to fiscal year 2022 including the transition quarter of 1976, so the average covers 50 years and one quarter.
[5] Congressional Budget Office, The Long-Term Budget Outlook 2022, (July 27, 2022), pp. 19-20. Found at: https://www.cbo.gov/system/files/2022-07/57971-LTBO.pdf
[6] Ibid.
[7] PL 105-33. Even though this Act created CHIP, CBO estimated reduced outlays by a net of $127 billion.
[8] PL 111-148.
[9] Mandatory outlays, for which Congress does not make annual appropriations, encompass (1) entitlement benefits that make transfer payments to or on behalf of individuals, and (2) federal guaranty programs. Entitlement benefits include (1) Social Security; (2) Medicare, Medicaid, Children’s Health Insurance, and Premium Tax Credits; (3) Income Security benefits; (4) Federal Civilian and Military Retirement and Disability benefits; (5) Veterans’ benefits other than health care, and (6) Agricultural subsidies. Income Security benefits include (1) Supplemental Nutrition Assistance Program (SNAP) benefits, (2) refundable portion of Child Tax Credit and Child and Dependent Care Tax Credit, (3) Earned Income Tax Credit (EITC), (4) Supplemental Security Income (SSI) benefits, (4) Coronavirus Payments and Tax Credits, (5) Family and Other Support Assistance, (6) Unemployment Compensation, (7) Certain Housing Assistance (including offsetting receipts), (8) General Retirement and Disability benefits, and (8) Payments to States for Foster Care/Adoption Assistance. In fiscal year 2022, mandatory outlays also included President Biden’s forgiveness of student loan debt. Mandatory outlays are growing faster than the U.S. economy in nominal terms.
———
Image credit: 401kcalculator.org | CC BY-SA 2.0.
