
Federal Spending Primer, Part II: The Spending Burden
By Robert P. O’Quinn*
There are several ways to measure the burden of government spending and how that burden changes over time. The simplest way is to look at how much government is spending and how much spending changes from one year to the next. However, using nominal dollar amounts is not the best way to understand fiscal data over many years, particularly because of inflation. Using inflation-adjusted (real) dollar data allows a more accurate measure of how the spending burden changes over time.
However, real dollar data does not reflect changes in population or the size of the economy over time. When trying to measure the economic burden of fiscal policy, one should consider the size of the economy. Therefore, the best way to understand the economic burden of the federal government and make comparison through time is by expressing federal outlays, federal receipts, federal budget deficits, and federal debt held by the public as a percent of gross domestic product (GDP).[1]
If government spending is expanding faster than the economy is growing, then the burden of government is increasing, as shown by an increase in how much of the nation’s GDP is diverted to finance the budget. By contrast, if the economy is growing faster than government spending, then the relative burden of government is decreasing, as shown by a reduction in government spending as a share of GDP.
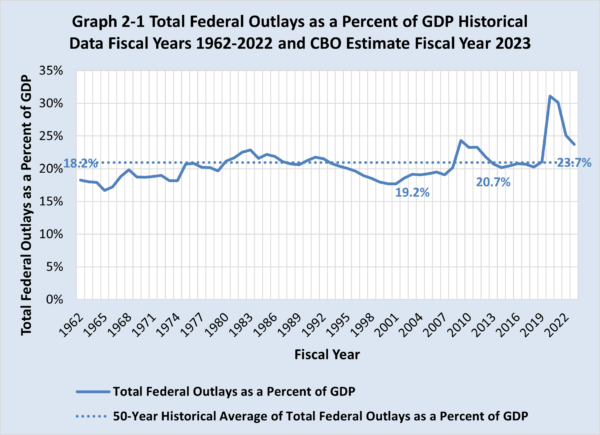
As shown in Graph 2-1, twenty years ago in fiscal year 2003, federal outlays equaled 19.2 percent of gross domestic product (GDP). Ten years ago in fiscal year 2013, federal outlays were 20.7 percent of GDP. The Congressional Budget Office (CBO) estimates that federal outlays will be 23.7 percent of GDP in the current fiscal year. Moreover, the burden of federal spending in the current fiscal year is significantly higher than its 50-year historical average of 20.9 percent.[2]
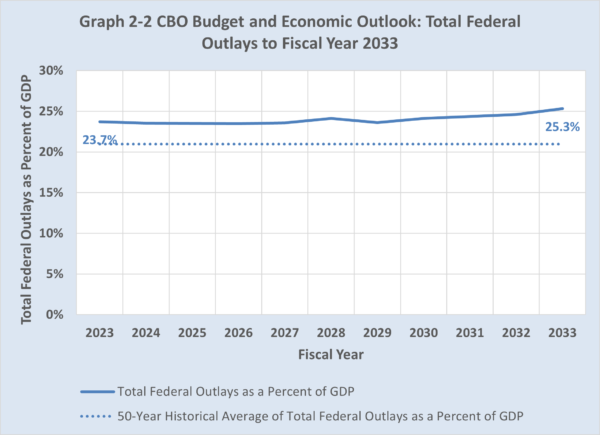
Without significant policy changes, federal spending will continue to grow faster than the U.S. economy. As shown in Graph 2-2, CBO’s most recent 10-year Budget and Economic Outlook projects that federal outlays will reach 25.3 percent of GDP in fiscal year 2033. CBO’s Long-Term Budget Projections project that the burden of federal spending will reach 30.2 percent of GDP in fiscal year 2053, which will be 9.3 percentage points higher than its 50-year historical average.
No free-lunch financing. Federal government outlays necessarily and unavoidably divert resources from the productive sector of the economy. Using the jargon of economists, labor and capital get misallocated, and this translates into less economic dynamism, lower productivity growth, and slower long-term economic growth. This damage occurs regardless of how the government raises money. That being said, every financing option has negative consequences. There is no free lunch.
- Tax-financed spending is economically counterproductive.[3] All taxes create a wedge between pre-tax income and after-tax income. As the tax wedge increases, the incentive for individuals and firms to undertake economically productive activities shrinks. Simply stated, taxes discourage work, saving, investment, and entrepreneurship, and the economic damage increases as tax rates go up. High tax rates are especially harmful in a competitive global economy.
- Debt-financed spending is economically counterproductive. Federal budget deficits require the federal government to borrow money from the domestic private sector or from foreign countries and to pay interest on such borrowings. Money borrowed by the federal government is unavailable to the private sector here and abroad to finance economically productive investments.
- Central bank-financed spending is economically counterproductive. Indeed, it is probably the case that the most economically destructive way that the federal government may finance its budget deficits is money creation. In countries such as Argentina and Zimbabwe, excessive “money printing” to finance budgets inevitably produces high price inflation.
Damage differs by spending type. Most government spending has a negative effect on economic performance. Entitlement programs that provide benefits to able-bodied working-age adults reduce labor force participation and economic output. Spending to increase the size of regulatory bureaucracies is especially damaging. And most government programs are inefficient and costly relative to any services such programs provide.
To be more precise, some types of government spending can be helpful to growth and other types of spending are usually harmful to growth.
- Rule-of-law spending – If done effectively, spending for pure public goods such as administration of justice and enforcement of contracts can create a favorable environment for economic growth. In fiscal year 2022, OMB reported that outlays for the administration of justice were $67.6 billion, which equaled 1.1 percent of total federal outlays and 0.3 percent of GDP.
- Physical capital spending – The economic growth effect (or anti-growth effect) depends on whether money for water and power projects, roads, ports, airports, and the like is spent efficiently, thus offsetting the cost of diverting resources from the economy’s productive sector. In fiscal year 2022, OMB reported that total federal outlays for non-defense physical structures and equipment (both direct and grants to state and local governments) were $149.6 billion, which equaled 2.4 percent of total federal outlays and 0.6 percent of GDP.[4]
- Research and development spending – Like physical capital spending, pro-economic growth effect (or anti-growth effect) depends on whether outlays are spent efficiently, thus offsetting the cost of diverting resources from the economy’s productive sector. In fiscal year 2020, OMB reported that outlays for research and development were $152.5 billion, equal to 2.4 percent of total federal outlays or 0.6 percent of GDP. Outlays for research and development were divided in half between national defense and non-defense purposes.[5]
- Human capital spending – The economic growth effect (or anti-growth effect) depends on whether money for education, training, etc., is spent efficiently, thus offsetting the cost of diverting resources from the economy’s productive sector. In general, efficient spending on primary and secondary education to achieve universal literacy and numeracy is more likely to produce positive externalities than spending on tertiary education (e.g., college and vocational training) whose benefits are largely internalized. In fiscal year 2022, OMB reported that outlays for education and training were $644.9 billion, which equaled 10.9 percent of total federal outlays and 2.7 percent of GDP. However, outlays in fiscal year 2022 were inflated by the one-time cost of $400 billion for President Biden’s initiative on student loan forgiveness. In real (2012) dollars, outlays for education and training in fiscal year 2022 were $543.9 billion, 308 percent higher than the average of $133.4 billion for the previous 10 fiscal years. In fiscal year 2023, the OMB estimates that outlays for education and training will fall back to $227.1 billion or $207.2 in real (2012) dollars.
- Defense/military spending may be necessary for national survival but is generally bad for economic growth since labor and capital are diverted from the economy’s productive sector to government. Armed conflict has strong anti-growth effects because of the destruction of human and physical capital. The only portion of national defense spending that can produce pro-growth effects is defense-related research and development because such outlays may produce technological spinoffs. In fiscal year 2022, OMB reported that outlays for national defense excluding research and development were $639.2 billion, equal to 10.2 percent of total federal outlays and 2.6 percent of GDP.
- Social welfare spending may be compassionate (or dependency inducing) but is otherwise bad for economic growth since social welfare spending (1) reduces labor force participation among able-bodied working-age adults, and (2) diverts labor and capital from the productive sector to government. In fiscal year 2022, OMB reported that total payments to and on behalf of individuals (excluding federal employee retirement and veterans’ service-related compensation) were $4.527 trillion, which equaled 72.2 percent of total federal outlays and 18.1 percent of GDP.
Most government spending is for social welfare programs. In fiscal year 2022, outlays for social welfare and national defense excluding research and development were $5.166 trillion, while outlays for rule-of-law, physical capital, research and development, and human capital less outlays for Biden’s student loan debt forgiveness initiative were $514 billion. Even if all of latter were spent efficiently and wisely, which is not, federal spending with known negative effects on economic growth is 10 times as large as federal spending could potentially have positive effects on economic growth. As such, the negative economic effects from the overall size of federal spending swamps any variation in the economic effects of different types of federal spending.
What about red ink? Increasing federal outlays have caused persistent federal budget deficits and a growing level of federal debt held by the public. Without policy changes, federal budget deficits will expand, and federal debt held by the public will swell to a historically unprecedented level over the next three decades.
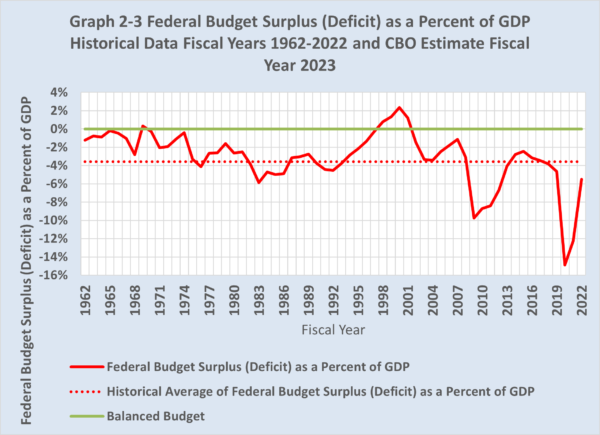
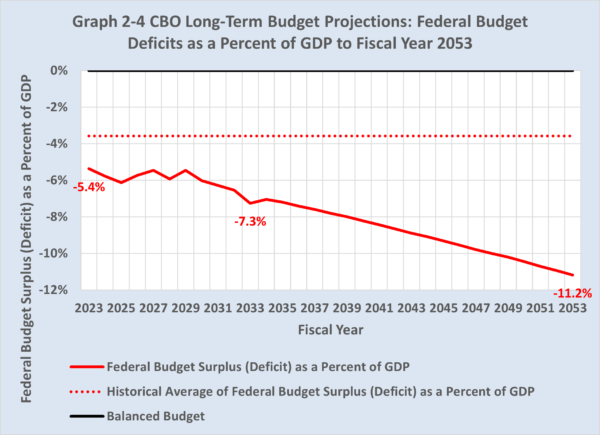
Graph 2-3 shows federal budget surpluses (deficits) since fiscal year 1962. As shown in Graph 2-4, CBO projects the federal budget deficit, currently 5.4 percent of economic output, will gradually increase to 7.3 percent of GDP in fiscal year 2033, which will be 3.8 percentage points above its 50-year historical average, and 11.2 percent of GDP in fiscal year 2053, which will be 7.7 percentage points above its 50-year historical average of 3.5 percent of GDP.
Even more worrisome, CBO projects that federal debt held by the public will soar to 118.2 percent of GDP in fiscal year 2033, which will be 71.7 percentage points above its 50-year historical average, and to 194.6 percent of GDP in fiscal year 2053, which will be 148.0 percentage points higher than its 50-year historical average, as shown in Graph 2-6.
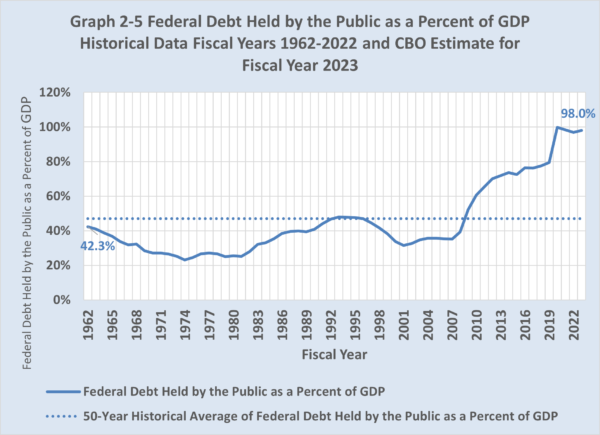
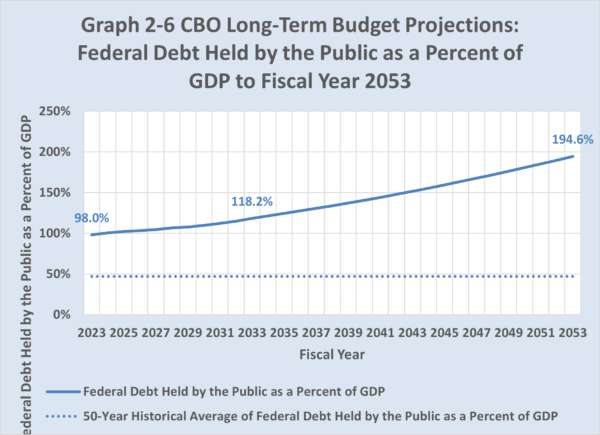
One might be tempted to conclude that the United States therefore has a problem with the federal budget deficits and growing level of federal debt. That is correct, but incomplete. Deficits and debt accumulation are actually the symptoms of the fundamental problem, which is the long-term growth of federal spending relative to the size of the U.S. economy. Specifically, federal outlays are growing faster than GDP through time.
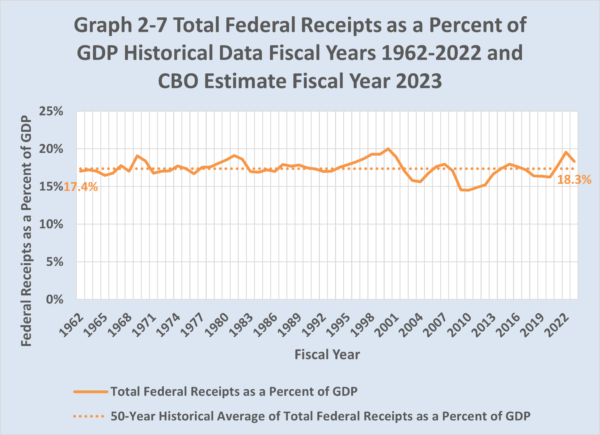
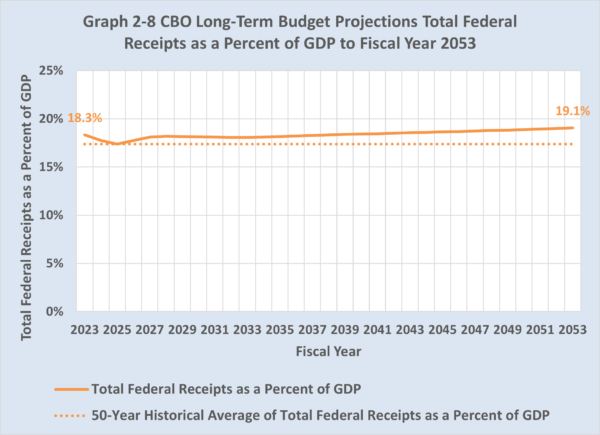
What about tax revenue? It is also important to understand that the problem is not caused by shrinking tax revenue. As shown in Graph 2-7, federal receipts averaged 17.4 percent of GDP over the last 50 fiscal years. CBO estimates that federal receipts will be 18.3 percent of GDP in the current fiscal year, 0.9 percentage above its 50-year historical average. As shown in Graph 2-8, CBO projects that federal receipts will be 18.1 percent of GDP in fiscal year 2033, 0.7 percentage points above its 50-year historical average, and 19.1 percent of GDP in fiscal year 2053, 1.7 percentage points above its 50-year historical average.
Conclusion
Federal outlays are growing significantly faster than the U.S. economy, while federal receipts are growing slightly faster than the U.S. economy. Consequently, federal budget deficits and federal debt held by the public are widening as a percent of GDP. Unless current policy changes, CBO projects that the rapid growth of federal outlays will drive federal budget deficits and the federal debt held by the public over the next 30 years to historically unprecedented levels.
But the key problem is the growing burden of spending. Replacing debt-financed spending with tax-financed spending would leave the nation’s fiscal burden unchanged. Or it might make a bad situation even worse if politicians increase spending because of an expectation of additional revenue. Needless to say, replacing debt-financed spending with central bank-financed spending also is not a good idea.
__________________________________
* Robert P. O’Quinn is the former Chief Economist at both U.S. Department of Labor and U.S. House of Representatives Committee on Ways and Means and former Executive Director at the U.S. Congress Joint Economic Committee.
[1] GDP is the market value of all final goods and services produced in a given territory in a given time usually a year. Thus, GDP is the sum of the value-added at every stage of production for all final goods and services produced in a given territory in a given time usually a year. GDP equals gross domestic income (GDI), which counts the money incomes earned and costs incurred in production of all final goods and services produced in a given territory in a given time usually a year, less any statistical discrepancy due to measurement errors. Thus, GDP (or equivalently GDI) measures the size of the economy from which a government may collect tax receipts.
[2] The position of an economy in the business cycle affects GDP, the federal outlays-to-GDP ratio, the federal receipts-to-GDP ratio, the federal budget surpluses (deficits)-to-GDP ratio, and the federal debt-to-GDP ratio in any particular year. A recession causes nominal GDP to decline. Since GDP is the denominator in these ratios, they will increase during a recession, all other things being constant. Moreover, a recession also affects the numerator in these ratios. Federal receipts, particularly individual and corporate income tax receipts, usually decline during a recession and sometimes during the following year. At the same time, outlays for federal income support entitlement programs (e.g., unemployment insurance) usually increase during a recession. Therefore, the federal outlays-to-GDP ratio, the federal receipts-to-GDP ratio, and the federal budget surpluses (deficits)-to-GDP ratio tend to tick up during a recession and tick down following a recession. The December 2007 to June 2009 recession and February 2020 to April 2020 recession demonstrate these effects on the federal outlays-to-GDP ratio, the federal receipts-to-GDP ratio, the federal budget surpluses (deficits)-to-GDP ratio, and the federal debt-to-GDP ratio.
[3] Moving from anarchy without taxes to a limited government financed by taxes may be economically productive if such government creates an effective rule of law where none previously existed. The United States has been well above a level at which taxes may be productive for a century or more.
[4] Direct federal outlays for non-defense physical structures and equipment were $45.4 billion, which equaled 0.7 percent of total federal outlays and 0.2 percent of GDP. Equipment acquisition and physical structures for water and power projects were and 45.4 percent and 18.8 percent, respectively, of direct federal outlays for non-defense physical structures and equipment. Grants to state and local governments for non-defense physical structures and equipment were $104.2 billion, which equaled 1.7 percent of total federal outlays and 0.4 percent of GDP. Grants for transportation were 82.0 percent of grants to state and local governments for non-defense physical structures and equipment.
[5] Among federal research and development outlays, 50.1 percent was used by the Departments of Defense and Energy for national defense; 25.5 percent by the National Institutes for Health for health; 7.5 percent by National Aeronautics and Space Administration for space exploration, 3.9 percent by the National Science Foundation for general science, 3.6 percent by the Department of Energy for civilian atomic power, and the remainder for other purposes including agricultural, natural resources, and the environment.
———
Image credit: Andy Withers | CC BY-NC-ND 2.0.
