
Free trade is good and protectionism is bad.
Assuming one agrees with those common-sense observations, the Tholos Foundation’s just-released Trade Barriers Index is a great source of data about which countries are pro-trade and anti-trade.
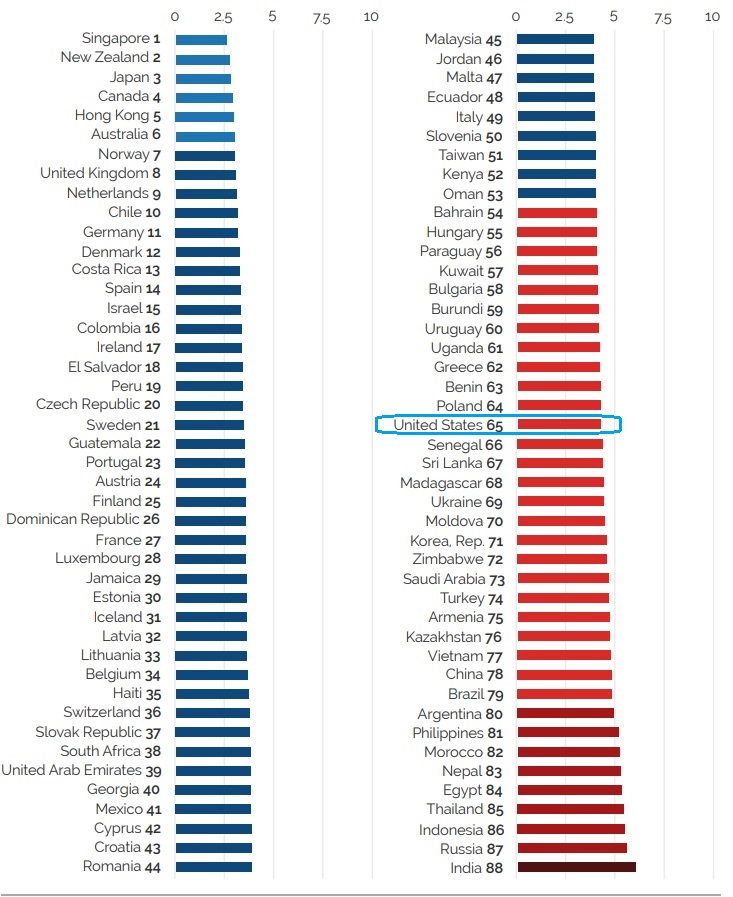
As you can see, Singapore has the fewest trade barriers (a lower score is good), followed by New Zealand. By contrast, India is in last place with the most trade barriers, followed by Russia.
Sadly, the United States ranks a lowly 65 out of 88 countries that were included in the report.
The Index is filled with data, so it is a treasure trove for wonks.
The part I like best, which is excerpted below, notes that pro-trade nations produce a disproportionate share of global economic output.
The 88 countries in the 2023 TBI house 72 percent of the world’s population. In the freest range, those with a score reaching between 2.5 and 3.0 or lower, only 6 countries with a combined population of 207 million, or 2.6 percent of the world’s people, enjoy the most barrier-free-trade and they produce 11 percent of the world’s GDP… In the mostly-free range, with a score between 3 and 3.5, reside 395 million people or 5 percent of the world’s population in 16 countries where they produce 14 percent of world GDP. In the next range, between 3.5 and 4.0 on the TBI, 7 percent of the world’s population produces 12 percent of global GDP. In the middle range between 4.0 and 4.5, productivity gets a boost due to the inclusion of the United States; in this range 650 million people reside and produce 28 percent of GDP. Then the inefficiencies of trade restrictions start to take a large toll. In the next 4.5 to 5.0 range, nearly 2 trillion people live, 24 percent of the world’s population, but they contribute only 22 percent of GDP. Then in the 5.0 to 5.5 range, in six countries, 8 percent of the world’s people reside and they produce a dismal 3 percent of world GDP. Lastly, in the 5.5 to 6.0 range 20 percent of the world’s population reside in 2 countries, India and Russia, where they produce 5 percent of world GDP.
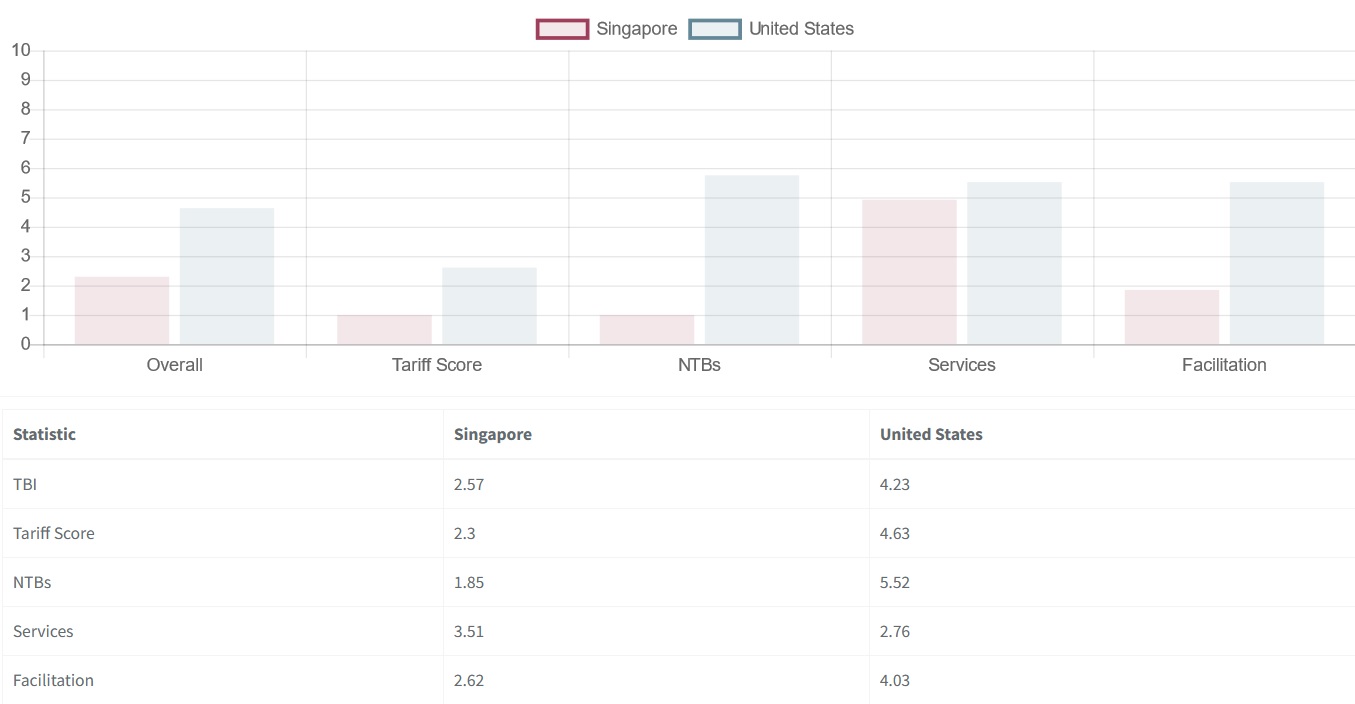
Let’s close with a comparison of the United States and Singapore.
In every single category, Singapore does better. But the biggest gap is in non-tariff barriers.
Needless to say, both Trump and Biden have contributed to America’s unimpressive score.
P.S. You’ll notice that trade balances are not part of the Trade Barriers Index. That’s because the authors understand trade deficits are irrelevant (or even a positive sign if a nations is attracting a lot of foreign investment).
———
Image credit: AKrebs60 | Pixabay License.