It usually is not fun writing about public policy, given my libertarian sentiments.
After all, politicians have a natural tendency to expand their powers and diminish our liberties.
So where there is occasional good news, I like to relish the moment.
For instance, I’ve been getting immense enjoyment from the progress on school choice over the past couple of years. Particularly the enactment of state-wide choice programs in West Virginia, Arizona, Iowa, and Utah.
Another area were we’ve seen big progress is state tax rates. I’ve also written about that topic, showing earlier this month how average top personal income tax rates have declined in recent years.
Today, let’s let a couple of maps tell the same story.
Here’s the Tax Foundation’s new map showing top personal tax rates for 2023. At the risk of stating the obvious, it’s best to be grey. But if you’re not grey, it’s good to be a lighter color and bad to be a darker color.

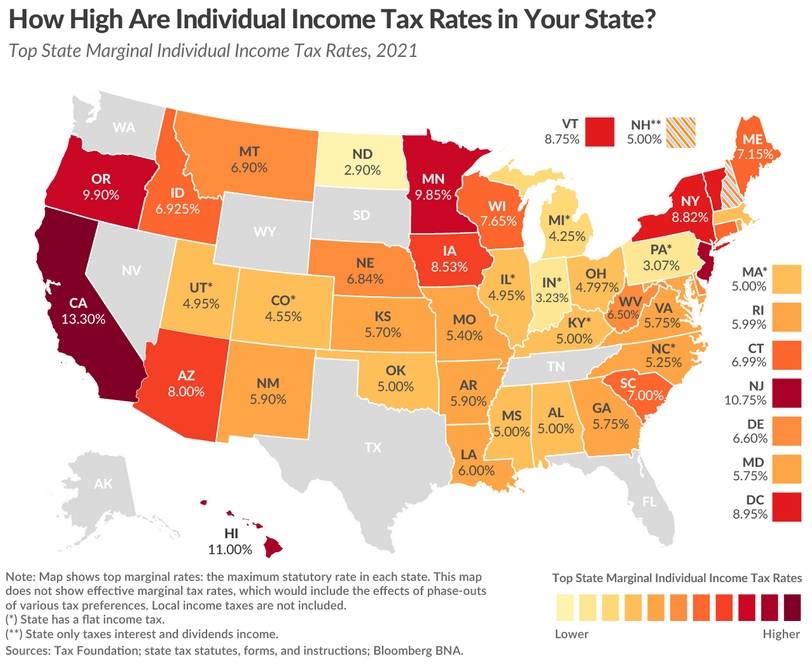
Now compare that map to the 2021 version. You’ll easily notice more dark-colored states.

But since the color schemes for the maps are not exactly the same, the best thing to compare numbers for specific states.
You’ll see some states have made huge progress, most notably Arizona and Iowa, but also incremental progress in most states.
By contrast, only a few states have moved in the wrong direction, most notably Massachusetts (thanks to a terrible referendum last November) and New York.
As you might expect, given the chance to “vote with their feet,” people and businesses are moving from high-tax states to low-tax states.
Yet that’s not stopping politicians in some high-tax states from agitating to push policy even further in the wrong direction. A very strange form of slow-motion economic suicide.

