The Congressional Budget Office has released its new Long-Term Budget Outlook and I will continue a now-annual tradition (see 2018, 2019, 2020, 2021, 2022) of sharing some very bad news about America’s fiscal future.
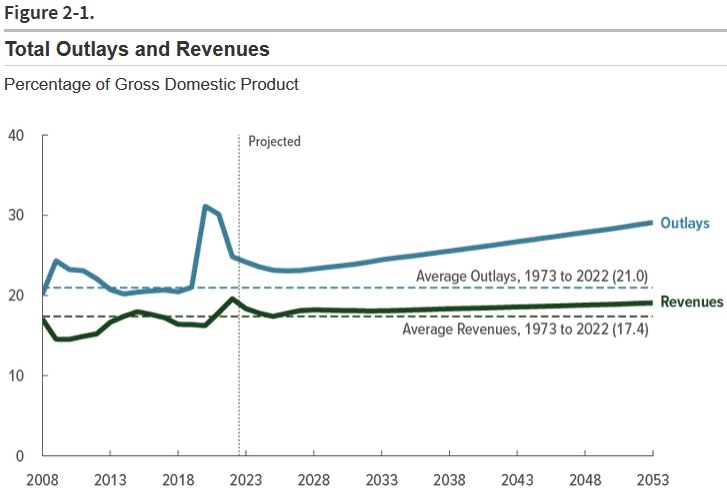
Here’s the most important chart. It shows two unfortunate developments. First, we see that the tax burden is gradually increasing as a share of economic output. Second, we see that the burden of federal spending is increasing even faster.

What happens when spending grows even faster than revenue?
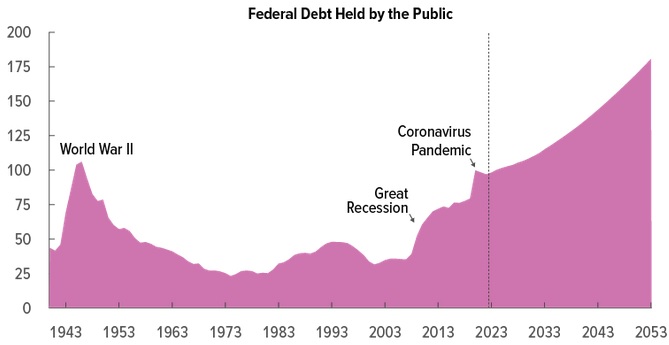
We get more government debt. Or, to be more precise, this next chart shows that we get a lot more debt.
Indeed, the debt is going to reach unprecedented levels over the next 30 years.

I normally don’t fret that much about red ink. After all, deficits and debt are largely symptoms of a much bigger problem, which is excessive government spending.
That being said, high levels of debt can trigger a crisis if investors decide (like they did in Greece) that a government can’t be trusted to pay all promised money to bondholders.
Now let’s get back to the underlying problem of too much government.
What’s driving America’s long-run problems? In part, the answer is higher interest payments on the ever-increasing debt.
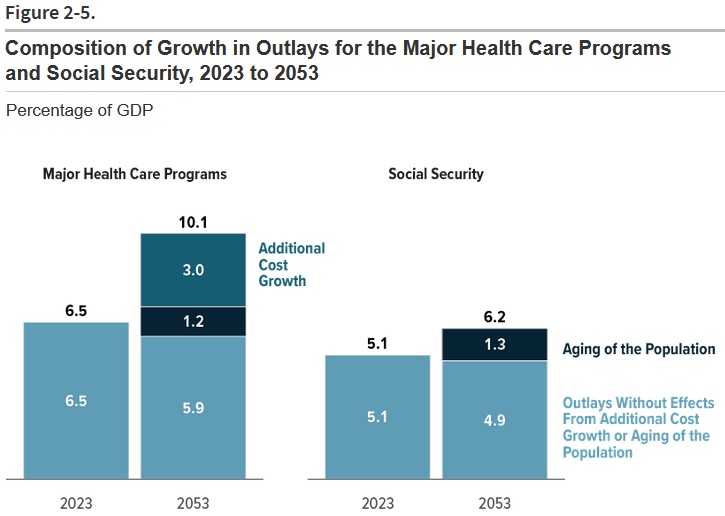
But the real problem, as CBO shows in Figure 2-5, is entitlement programs.

Looking at the above charts, and at the risk of repeating what I’ve already written (many times), the United States is between a rock and a hard place. The only choices are:
- Keep fiscal policy on auto-pilot, allowing government to grow until we suffer a Greek-style debt crisis.
- Impose massive tax increases on the middle class to finance an ever-bigger future government.
- Reform entitlement programs to restrain the growing burden of government spending.
Unlike Joe Biden and Donald Trump, I think the obvious choice is #3.
P.S. There was some sensible economic analysis in the CBO report.
Here’s what it said about the economic impact of deficits.
Deficits grow in the agency’s budget projections, and as a result, the federal government borrows more each year. That increase in federal borrowing pushes up interest rates and thus reduces private investment in capital, causing output to be lower in the long term than it would be otherwise, especially in the last two decades of the projection period. Less private investment reduces the amount of capital per worker, making workers less productive and leading to lower wages. Those lower wages reduce people’s incentive to work and, consequently, lead to a smaller supply of labor.
And here’s what CBO says about the impact of taxes.
Under current law, tax rates on individual income will rise at the end of 2025 when those provisions are scheduled to expire. Moreover, as income rises faster than inflation, more income is pushed into higher tax brackets over time. That real bracket creep results in higher effective marginal tax rates on labor income and capital income.11 Higher marginal tax rates on labor income would reduce people’s after-tax wages and weaken their incentive to work. Likewise, an increase in the marginal tax rate on capital income would lower people’s incentives to save and invest, thereby reducing the stock of capital and, in turn, labor productivity. That reduction in labor productivity would put downward pressure on wages. All told, less private investment and a smaller labor supply decrease economic output and income in CBO’s extended baseline projections.
Nothing wrong with that analysis. There are negative consequences when governments borrow and there are negative consequences when governments tax. But there was a sin of omission. CBO also should have explained (as it has on other occasions) that there are negative economic consequences when governments spend.
———
Image credit: Andy Withers | CC BY-NC-ND 2.0.


