The Laffer Curve is a method for illustrating the relationship between tax rates, taxable income, and tax revenue.
But it’s important to realize that there are actually lots of varieties.
The Laffer Curve for capital gains taxes, for instance, will look different than the Laffer Curve for payroll taxes. Or corporate taxes. Or marijuana taxes.
In every case, the shape of the curve will depend on what’s being taxed and the ability of affected taxpayers to alter their behavior.
And the shape of the Laffer Curve also will depend on whether one is measuring the short-run revenue impact of tax changes or the long-run impact of tax changes.
Given all these varieties, no wonder so many people, both right and left, sometimes misstate its meaning.
Let’s try to expand our understanding of the Lafffer Curve by looking at some new research.
Professor Aaron Hedlund of the University of Missouri authored a study on the Laffer Curve for the Show Me Institute.
Here’s what he wants to understand.
Empirically, recent research provides a variety of estimates for the revenue-maximizing and welfare-maximizing tax rates, but one lesson that emerges is that analyses that only take into account the response of hours worked to tax increases are bound to greatly overestimate the amount of new revenue that can be raised while underestimating the economic damage from lost GDP growth and wages. This paper examines the relationship between tax rates and revenue by taking a broader view that encompasses the responses of skill acquisition, entrepreneurship, innovation, and the labor market behavior of dual-earner families. The bottom line that emerges is that these additional margins of adjustment imply significantly lower revenue-maximizing and welfare-enhancing tax rates.
He then explains that some economists fail to look at all possible behavioral responses.
Traditionally, much of the economic analysis aimed at finding this peak rate has focused on how the income tax rate affects an individual’s willingness to work, both with regard to hours worked and the decision to enter the labor force at all. Moreover, until the recent arrival of better data, much of the academic research considered only the response of heads of households. …This assumption of tax rate insensitivity led economists Peter Diamond and Emmanuel Saez to conclude that the optimal—revenue maximizing—top income tax rate is 73%. Moreover, in an analysis that also considers the social insurance benefits of progressive taxation—specifically, the ability of redistribution to soften the blow of unexpected economic hardship—economists Fabian Kindermann and Dirk Krueger provide justification for a top rate that approaches 90%. However, both studies omit the many other margins of behavioral adjustment that accompany any significant change to tax rates.
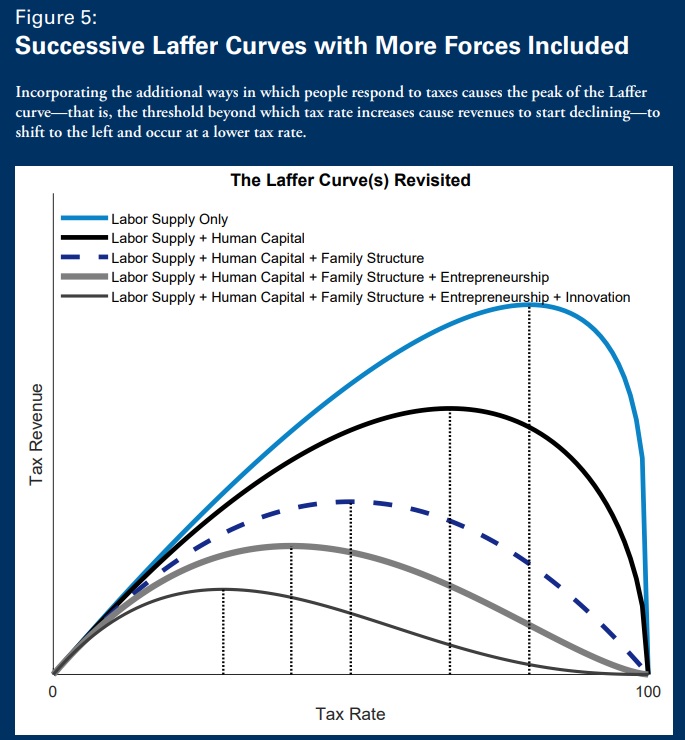
When all behavioral responses are measured, it turns out that the revenue-maximizing rate is much lower.
In one study that accounts for the sensitivity of entrepreneurs to tax rates, increasing the progressivity of the income tax code leads to a revenue-maximizing top rate of only 33%. Furthermore, in this case revenues only increase by 5%—amounting to less than one percentage point of GDP. Another study finds even starker results when looking at the subset of superstar entrepreneurs. In an analysis that incorporates the positive spillovers of ideas and innovation on economic growth, economist Charles Jones finds that the revenue-maximizing tax rate may even be as low as 29%. Furthermore, he shows that raising the top income tax rate to 75% could reduce GDP by over 8%, which would greatly blunt the impact on revenues by shrinking the tax base.
Figure 5 from the study shows how the revenue-maximizing rate varies depending on which factors are included in the study.

My two cents on this issue is to remind readers that we don’t want to maximize revenue for politicians.
As such, I don’t care if the revenue-maximizing rate in 29 percent or 73 percent.
I want to be at the growth-maximizing rate, which is where the government only collects the amount of money that is necessary to finance genuine public goods.
Needless to say, that means tax rates (and spending burdens) far lower than today.
P.S. Tax accountants have a very good understanding of the Laffer Curve.
P.P.S. Heck, even the thugs from ISIS understand the Laffer Curve.
P.P.P.S. Sadly, it doesn’t matter if some leftists understand the Laffer Curve.
———
Image credit: Gage Skidmore | CC BY-SA 2.0.


