The Congressional Budget Office has released its new long-run fiscal forecast. Like I did last year (and the year before, and the year before, etc), let’s look at some very worrisome data.
We’ll start with projections over the next three decades for taxes and spending, measured as a share of economic output (gross domestic product). As you can see, the tax burden is increasing, but the spending burden is increasing even faster.
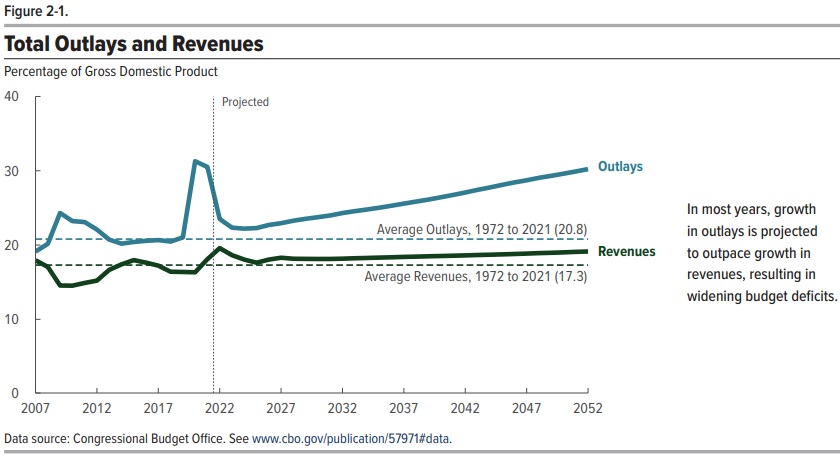
By the way, some people think America’s main fiscal problem is the gap between the two lines. In other words, they worry about deficits and debt.
But the real problem is government spending. And that’s true whether the spending burden is financed by taxes, borrowing, or printing money.
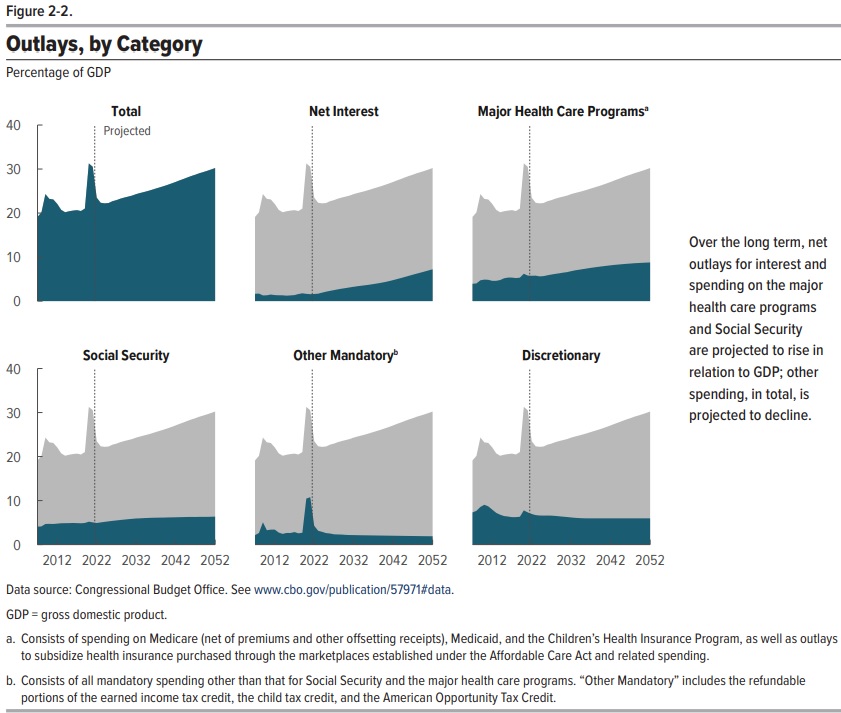
So why is the burden of government spending projected to get larger?
As you can see from Figure 2-2, entitlement programs deserve the lion’s share of the blame. Social Security spending is expanding as a share of GDP, and health entitlements (Medicare, Medicaid, and Obamacare) are expanding even faster.
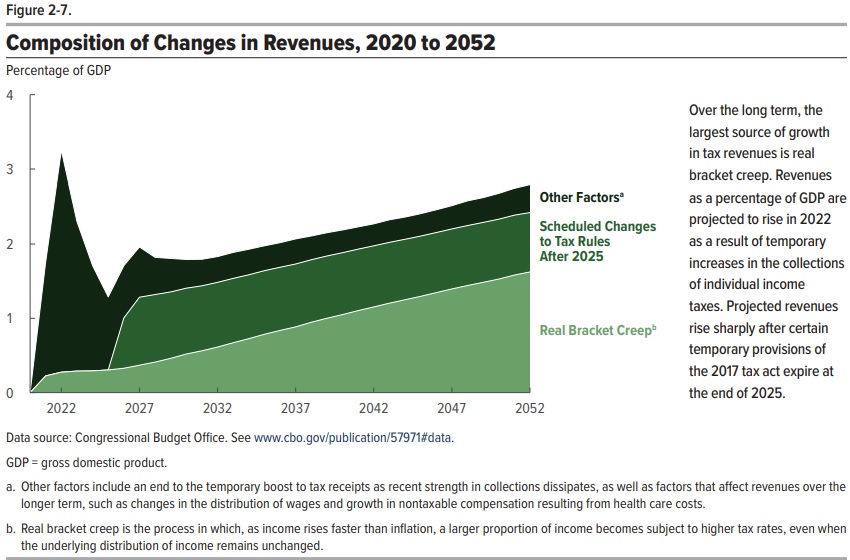
Now let’s confirm that the problem is not on the revenue side.
As you can see from Figure 2-7, taxation is expected to consume an ever-larger share of economic output in future decades. And that’s true even if the Trump tax cuts are made permanent.
Having shared three charts from CBO’s report, it’s now time for a chart that I created using CBO’s long-run data.
My chart shows that America’s main fiscal problem is that we are not abiding by fiscal policy’s Golden Rule. To be more specific, the burden of government is projected to grow faster than the economy.
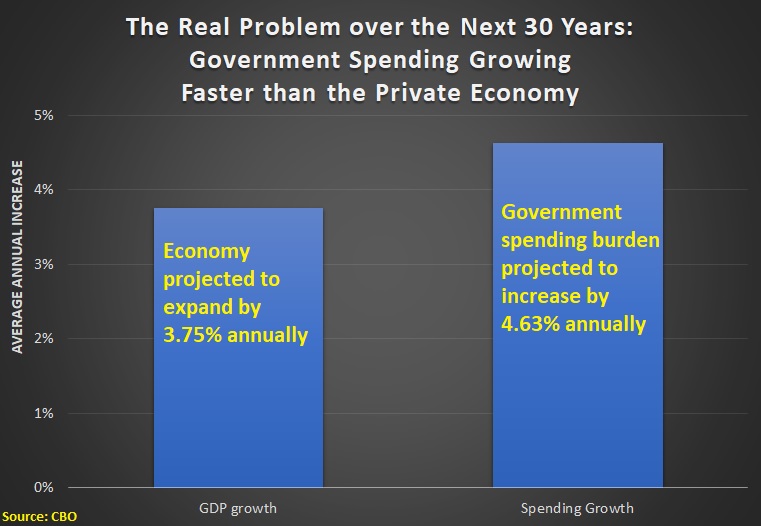
So long as the burden of government is expanding faster than the private sector, that’s a recipe for higher taxes, more debt, and reckless monetary policy.
All of those options lead to the same bad outcome.
———
Image credit: Shaw Girl | CC BY-NC-ND 2.0.

