The United States conducted an experiment in the 1980s. Reagan dramatically lowered the top tax rate on households, dropping it from 70 percent to 28 percent.
Folks on the left bitterly resisted Reagan’s “supply-side” agenda, arguing that “the rich won’t pay enough” and “the government will be starved of revenue.”
Fortunately, we can look at IRS data to see what happened to tax payments from those making more than $200,000 per year.
Lo and behold, it turns out that Reaganomics was a big success. Uncle Sam collected five times as much money when the rate was slashed.

As I’ve previously written, this was the Laffer Curve on steroids. Even when you consider other factors (population growth, inflation, other reforms, etc), there’s little doubt that we got a big “supply-side effect” from Reagan’s tax reforms.
Now Biden wants to run this experiment in reverse.
Based on basic economics, his approach won’t succeed. But let’s augment theory by examining what actually happened when Hoover and Roosevelt raised tax rates in the 1930s.
Alan Reynolds reviewed tax policy in the 1920s and 1930s, but let’s focus on what he wrote about the latter decade. He starts with some general observations.
Large increases in marginal tax rates on incomes above $50,000 in the 1930s were almost always matched by large reductions in the amount of high income reported and taxed… An earlier generation of economists found that raising tax rates on incomes, profits, and sales in the 1930s was inexcusably destructive. In 1956, MIT economist E. Cary Brown pointed to the “highly deflationary impact” of the Revenue Act of 1932, which pushed up rates virtually across the board, but notably on the lower‐and middle‐income groups.
He then gets to the all-important issue of higher tax rates leading to big reductions in taxable income.
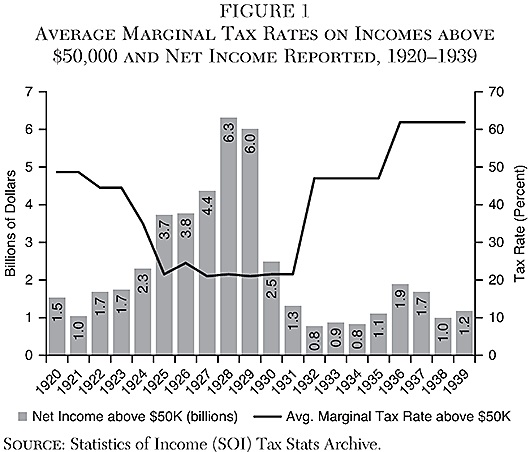
In Figure 1, the average marginal tax rate is an unweighted average of statutory tax brackets applying to all income groups reporting more than $50,000 of income. After President Hoover’s June 1932 tax increase (retroactive to January) the number of tax brackets above $50,000 quadrupled from 8 to 32, ranging from 31 percent to 63 percent. The average of many marginal tax rates facing incomes higher than $50,000 increased from 21.5 percent in 1931 to 47 percent in 1932, and 61.9 percent in 1936. One of the most striking facts in Figure 1 is that the amount of reported income above $50,000 was almost cut in half in a single year—from $1.31 billion in 1931 to $776.7 million in 1932.
Here’s the aforementioned Figure 1. You can see that taxable income soared when tax rates were slashed in the 1920s.
But when tax rates were increased in the 1930s, taxable income collapsed and never recovered.

What’s the lesson from this chart? As Alan explained, the lesson is that high tax rates lead to rich people earning and declaring less taxable income (they still have that ability today).
In the eight years from 1932 to 1939, the economy was in cyclical contraction for only 28 months. Even in 1940, after two huge increases in income tax rates, individual income tax receipts remained lower ($1,014 million) than they had been in the 1930 slump ($1,045 million) when the top tax rate was 25 percent rather than 79 percent. Eight years of prolonged weakness in high incomes and personal tax revenue after tax rates were hugely increased in 1932 cannot be easily brushed away as merely cyclical, rather than a behavioral response to much higher tax rates on additional (marginal) income. Just as income (and tax revenue) from high‐income taxpayers rose spectacularly after top tax rates fell from 1921 to 1928, high incomes and revenue fell just as spectacularly in 1932 when top tax rates rose.
One big takeaway is that Hoover and FDR were two peas in a pod.
Both imposed bad tax policy.
From 1930 to 1937, unlike 1923–25, virtually all federal and state tax rates on incomes and sales were repeatedly increased, and many new taxes were added, such as the Smoot‐Hawley tariffs in 1930, taxes on alcoholic beverages in December 1933, and a Social Security payroll tax in 1937. Annual growth of per capita GDP from 1929 to 1939 was essentially zero. …To summarize: all the repeated increases in tax rates and reductions of exemptions enacted by presidents Hoover and Roosevelt in 1932–36 did not even manage to keep individual income tax collections as high in 1939–40 (in dollars or as a percent of GDP) as they had been in 1929–30. The experience of 1930 to 1940 decisively repudiated any pretense that doubling or tripling marginal tax rates on a much broader base proved to be a revenue‐maximizing plan.
Alan closes with an observation that should raise alarm bells.
It turns out that the higher tax rates on the rich were simply the camel’s nose under the tent. The real agenda was extending the income tax to those with more modest incomes.
The most effective and sustained changes in personal taxes after 1931 were not the symbolic attempts to “soak the rich,” but rather the changes deliberately designed to convert the income tax from a class tax to a mass tax. The exemption for married couples was reduced from $3,500 to $2,500 in 1932, $2,000 in 1940, and $1,500 in 1941. Making more low incomes taxable quadrupled the number of tax returns from 3.7 million in 1930 to 14.7 million in 1940… The lowest tax rate was also raised from 1.1 percent to 4 percent in 1932, 4.4 percent in 1940, and 10 percent in 1941.
The same thing will happen today if Biden succeeds in raising taxes on the rich. Those tax hikes won’t collect much revenue, but politicians will increase spending anyhow. They’ll then use high deficits as an excuse for higher taxes on lower-income and middle-class taxpayers (some of the options include financial taxes, carbon taxes, and value-added taxes).
Lather, rinse, repeat. Until the United States is Europe. And that will definitely be bad news for ordinary people.
P.S. Here’s what we can learn about tax policy in the 1920s. And the 1950s.
P.P.S. The 1920s and 1930s also can teach us an important lesson about growth and inequality.
———
Image credit: U.S. National Archives and Records Administration | Public Domain.


