Our friends on the left believe (or at least claim to believe) that the United States is an unfair nation because the rich get richer and the poor get poorer.
More specifically, they assert that the economy is a fixed pie and that when people like Bill Gates and Jeff Bezos become rich, then there is less prosperity for everyone else.
This is grotesquely inaccurate, as I explained earlier this year.
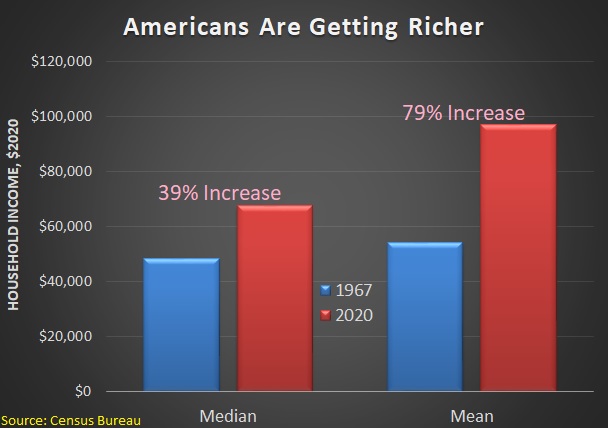
We have a great opportunity to revisit this issue because the Census Bureau just released its annual report on Income and Poverty in the United States. I went to Table A2 and created this chart to show how inflation-adjusted income has increased over time for the average household.

In other words, families are earning more, no matter how we measure the average (“median” is the household in the middle and “mean” is the average of all households).
By the way, when you break down the data by quintiles, as I did back in 2018, you find that a big overlap in the economic well-being of all income groups.
Simply stated, we rise and fall together based on the health of the overall economy. That’s true for the poor, true for the rich, and true for the middle class.
Which is why growth is so important, especially for the least fortunate.
But it’s not simply about growth. It’s also about people’s decisions.
Mark Perry, an invaluable scholar at the American Enterprise Institute, crunched the data from the Census Bureau’s report and here are some of his key findings.
On average, there are five times more income earners per household in the top income quintile households (2.0) than earners per household in the lowest-income households (0.40). …the average number of earners per household increases for each higher income quintile, demonstrating that one of the main factors in explaining differences in income among US households is the number of earners per household. …More than six out of every ten American households (64.7%) in the bottom fifth of households by income had no earners in 2020. …more evidence of the strong relationship between average household income and income earners per household. …the key demographic factors that explain differences in household income are not fixed over our lifetimes and are largely under our control (e.g., staying in school and graduating from high school and college, getting and staying married, working full-time, etc.), which means that individuals and households are not destined to remain in a single-member, low-income quintile forever.
The bottom line is that income is correlated with work, which is hardly a surprise.
But it also is correlated with other choices such as marriage and graduation, as the great Walter Williams sagely observed.

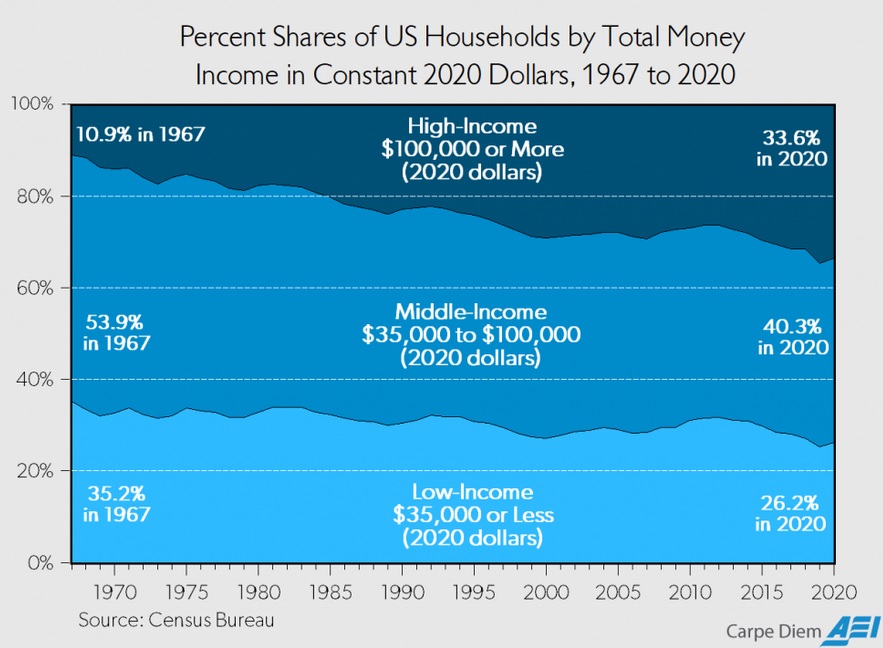
Let’s wrap up looking at some additional data from Mark Perry.
Our left-leaning friends routinely assert that the middle class is shrinking.
It turns out that they’re right, but not because people are becoming poor. Instead, more and more households are earning above $100,000.

The moral of the story is that free enterprise delivers great results, assuming that politicians don’t smother it with excessive taxes, spending, regulation, and intervention.
And if we want faster growth, we need smaller government.
P.S. We can learn a very important lesson about the effect of big government by comparing living standards in the United States and other developed nations.
P.P.S. For those who want to learn more about income mobility, I strongly recommend this video from Russ Roberts.
P.P.P.S. This data on global income also shows that the economy is not a fixed pie.
———
Image credit: Pictures of Money | CC BY 2.0.


