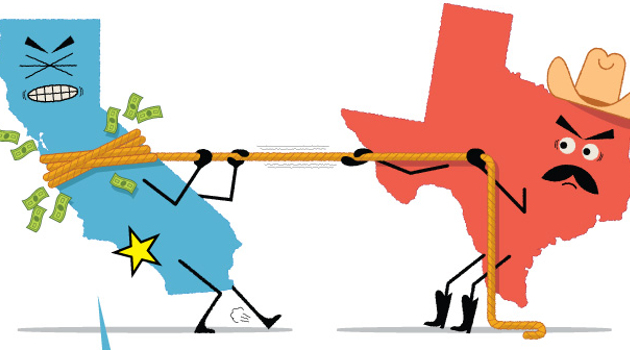
I’ve written favorably about the pro-growth policies of low-tax states such as Texas, Florida, and Tennessee, while criticizing the anti-growth policies of high-tax states such as Illinois, California, and New York.
Does that mean we should conclude that “red states” are better than “blue states”? In this video for Prager University, Steve Moore says the answer is yes.
The most persuasive part of the video is the data on people “voting with their feet” against the blue states.
There’s lots of data showing a clear relationship between the tax burden and migration patterns. Presumably for two reasons:
 People don’t like being overtaxed and thus move from high-tax states to low-tax states.
- More jobs are created in low-tax states, and people move for those employment opportunities.
There’s a debate about whether people also move because they want better weather.
I’m sure that’s somewhat true, but Steve points out in the video that California has the nation’s best climate yet also is losing taxpayers to other states.
Since we’re discussing red states vs blue states, let’s look at some excerpts from a column by Nihal Krishan of the Washington Examiner.
States run by Republican governors on average have economically outperformed states run by Democratic governors in recent months. …Overall, Democratic-run states, particularly those in the Northeast and Midwest, had larger contractions in gross domestic product than Republican-run states in the Plains and the South,
according to the latest state GDP data for the second quarter of 2020, released by the Commerce Department on Friday. Of the 20 states with the smallest decrease in state GDP, 13 were run by Republican governors, while the bottom 25 states with the highest decrease in state GDP were predominantly Democratic-run states. …Republican-controlled Utah had the second-lowest unemployment rate in the country in August at 4.1%, and the second-lowest GDP drop, at just over 18% in the second quarter. Nevada, run by Democrats, had the highest unemployment rate, at 13.2%. It was closely followed by Democratic-run Rhode Island, 12.8%, and New York, 12.5%.
Krishan notes that this short-run data is heavily impact by the coronavirus and the shutdown policies adopted by various states, so it presumably doesn’t tell us much about the overall quality (or lack thereof) of economic policy.
 I wrote about some multi-year data last year (before coronavirus was a problem) and found that low-tax states were creating jobs at a significantly faster rate than high-tax states.
But even that data only covered a bit more than three years.
I prefer policy comparisons over a longer period of time since that presumably removes randomness. Indeed, when comparing California, Texas, and Kansas a few years ago, I pointed out how a five-year set of data can yield different results (and presumably less-robust and less-accurate results) than a fifteen-year set of data.
P.S. What would be best is if we had several decades of data that could be matched with rigorous long-run measures of economic freedom in various states – similar to the data I use for my convergence/divergence articles that compare nations. Sadly, we have the former, but don’t have the latter (there are very good measures of economic freedom in the various states today, but we don’t have good historical estimates).

