I know exactly how Ronald Reagan must have felt back in 1980 when he famously said “There you go again” to Jimmy Carter during their debate.
That’s because I endlessly have to deal with critics who try to undercut the Laffer Curve by claiming that it’s based on the notion that all tax cuts “pay for themselves.”
Now it’s time for me to say “There you go again.”
Reuters regurgitated this misleading trope about the Laffer Curve last year, issuing a report about how the head of the Congressional Budget Office supposedly disappointed “devotees” of “Reaganomics” by saying that tax cuts are not self-financing.
The…Republican-appointed director of the Congressional Budget Office delivered some bad news…to the party’s “Reaganomics” devotees: Tax cuts don’t pay for themselves through turbocharged economic growth. Keith Hall, who served as an economic adviser to former President George W. Bush, made the pronouncement… “No, the evidence is that tax cuts do not pay for themselves,” Hall said in response to a reporter’s question. “And our models that we’re doing, our macroeconomic effects, show that.” His comment is at odds with lingering economic theory from the 1980s.
Well, I’m a “devotee of Reaganomics.” So was I disappointed?
Nope. I largely agree with the CBO Director on this topic.
But I think he should have included two caveats.
First, while there are some politicians (both now and also back in the 1980s) who blindly act as if all tax cuts are self-financing, Reaganomics was not based on that notion.
Instead, proponents of the Reagan tax cuts  simply argued reforms would lead to more growth – and therefore more taxable income. And, on that basis, it was a slam-dunk victory.
Interestingly, the report from Reuters quasi-admits that Reaganomics wasn’t based on self-financing tax cuts, noting instead that the core belief was that revenue generated by additional growth would result in “less need” (as opposed to “no need”) to find offsetting budget cuts.
Stronger economic growth generated by tax cuts would boost revenues so much that there is less need to find offsetting savings.
The second caveat is that not all tax cuts (or tax increases) are created equal. Some changes in tax policy have big effects on incentives to work, save, and invest. Others don’t have much impact on economic activity because the tax system’s penalty on productive behavior isn’t altered.
In a few cases, it actually is possible for a tax cut to be self-financing. But in the vast majority of cases, the real issue is the degree to which there is some amount of revenue feedback. In other words, the discussion should focus on the extent to which the foregone revenue from lower tax rates is offset by revenue gains from increased taxable income.
Let’s now look at a real-world example from Sweden to see how politicians are blind to this common-sense insight. The left-wing coalition government in that country indirectly increased marginal tax rates (by phasing out a credit) for some high-income taxpayers this year. The experts at Timbro have examined the potential revenue impact. They start with a description of what happened to policy.
To finance their reforms, …the marginal tax rate for some 400,000 people working in Sweden – e g doctors, engineers, accountants/auditors and others in high income brackets – will be increased by three percentage points to 60 per cent. …it is also necessary to take into consideration payroll tax… Under current rules, the effective marginal tax rate is 75 per cent for high earners. After the phase-out it rises to 77 per cent.
Amazingly, the Swedish government assumes that taxpayers won’t change their behavior in reaction to this high marginal tax rate.
Decades of economics research show that if you raise income tax, people will reduce their working time, put in less effort on the job and engage in more tax planning. When the government calculated the expected increase in revenue of SEK 2.7 billion from the earned income tax credit’s phase out, it failed to take changes in behaviour into consideration because revenue and expenses in the budget are calculated statically.
The folks at Timbro explain what likely will happen as upper-income taxpayers respond to the higher marginal tax rate.
The amount of revenue generated from a tax hike depends on how people change their behaviour as a result. … High elasticity means that salary earners are sensitive to changes in taxation, and that they are very likely to alter their behaviour with certain types of reforms. Examples of this are increasing or decreasing hours worked, switching jobs, or starting a company to enable more tax-planning options. …Elasticity of 0.3 is often used in international literature (e g Hendren, 2014) as a reasonable estimate of the mainstream for this area of research. Piketty & Saez (2012) state that most estimates of elasticity are within the range of 0.1 and 0.4. They conclude that 0.25 is “a realistic mid-range estimate” of elasticity.
So what happens when you apply these measures of taxpayer responsiveness to the Swedish tax hike?
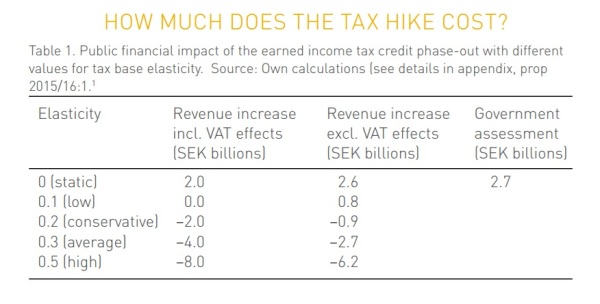
With zero elasticity, i e a static assessment, the revenue increase from phase-out of the earned income tax is assessed at SEK 2.6 billion. That is in line with the government’s estimate of SEK 2.7 billion. … all revenue disappears already at a low, 0.1, level of elasticity.
And when you look at the more mainstream measures of taxpayer responsiveness, the net effect of the government’s tax hike is that the Swedish Treasury will have less revenue.

In other words, this is one of those rare examples of taxable income changing by enough to swamp the impact of the change in the marginal tax rate.
And since we’re dealing with turbo-charged examples of the Laffer Curve, let’s look at what my colleague Alan Reynolds shared about the “huge across-the-board increase in marginal tax rates…Herbert Hoover pushed for” in the early 1930s.
Total federal revenues fell dramatically to less than $2 billion in 1932 and 1933 – after all tax rates had been at least doubled and the top rate raised from 25% to 63%. That was a sharp decline from revenues of $3.1 billion in 1931 and more than $4 billion in 1930, when the top tax was just 25%. …Revenues fell even as a share of falling GDP – from 4.1% in 1930 and 3.7% in 1931 to 2.8% in 1932 (the first year of the Hoover tax increase) and 3.4% in 1933. That illusory 1932-33 “increase” was entirely due to less GDP, not more revenue.
Roosevelt’s additional tax increases in the mid-1930s didn’t work much better.
The 15 highest tax rates were increased again in 1936, dividends were made fully taxable at those higher rates, and both corporate and capital gains tax rates were also increased… Yet all of those massive “tax increases”…failed to bring as much revenue in 1936 as was collected with much lower tax rates in 1930.
The point of these examples is not that governments wound up with less money. What matters is that politicians destroyed private-sector output as a consequence of more punitive tax policy.
And that’s why the tax increases that generate more tax revenue are almost as misguided as the ones that lose revenue.
Consider Hillary Clinton’s tax-hike plan. The Tax Foundation crunched the numbers and concluded it would generate more revenue for the federal government. But I argued that shouldn’t matter.
…she’s willing to lower our incomes by 0.80 percent to increase the government’s take by 0.46 percent. A good deal for her and her cronies, but bad for America.
At the risk of repeating myself, we shouldn’t try to be at the revenue-maximizing point of the Laffer Curve.

