As I’ve pointed out before, the big difference between the United States and Europe is not taxes on the rich. We both impose similar tax burden on high-income taxpayers, though Europeans are more likely to collect revenue from the rich with higher income tax rates and the U.S. gets a greater share of revenue from upper-income taxpayers with double taxation on interest, dividends, and capital gains (we also have a very punitive corporate tax system, though it doesn’t collect that much revenue).
The real difference between America and Europe is that America has a far lower tax burden on lower- and middle-income taxpayers.
- Tax rates in Europe, particularly the top rate, tend to take effect at much lower levels of income.
- European governments all levy onerous value-added taxes that raise costs for all consumers.
- Payroll tax burdens in many European nations are significantly higher than in the United States.
This makes for interesting cross-border comparisons, but it also raises an overlooked point about political attitudes. Why are leftists so hostile to successful people?
Think about it this way. If a farmer has five cows but one of the cows produces most of his milk, at the very least he would treat that cow with great care and concern.
Left-wing politicians in the United States, by contrast, express contempt and disdain for the upper-income taxpayers who finance our welfare state.
Let’s look at some of the numbers
The invaluable Mark Perry of the American Enterprise Institute points out that the top-20 percent bear the lion’s share of the fiscal burden in the United States.
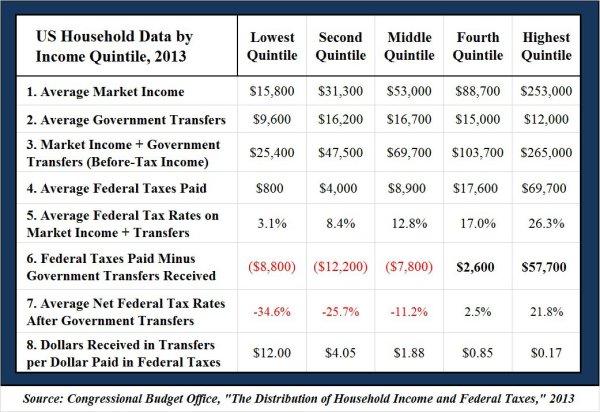
CBO provides detailed data on American households for each income quintile in 2013 for: a) average household “market income”(includes labor income, business income, income from capital gains, and retirement/pension income), b)average household transfer payments (payments and benefits from federal, state and local governments including Social Security, Medicare, Medicaid, unemployment insurance, and Supplemental Nutrition Assistance Program (SNAP)), and c) average federal taxes paid by households (including income, payroll, corporate, and excise taxes).
Mark presents that data in an easy-to-understand format and highlights the relevant numbers in red. The key takeaway is that the top-20 percent basically finance our Leviathan.

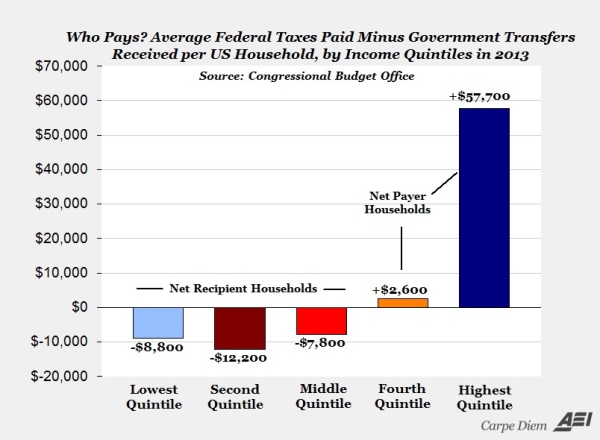
To make the issue even clearer, Mark created a chart showing the data from the sixth line in the above table.
Again, the only possible conclusion to reach is that higher-income households are the net financiers of big government.

Now let’s augment Mark’s analysis by examining some research from Scott Greenberg and John Olson of the Tax Foundation.
They also review the new CBO numbers and their focus in the tax burden on the top-1 percent (i.e., people who actually are rich).
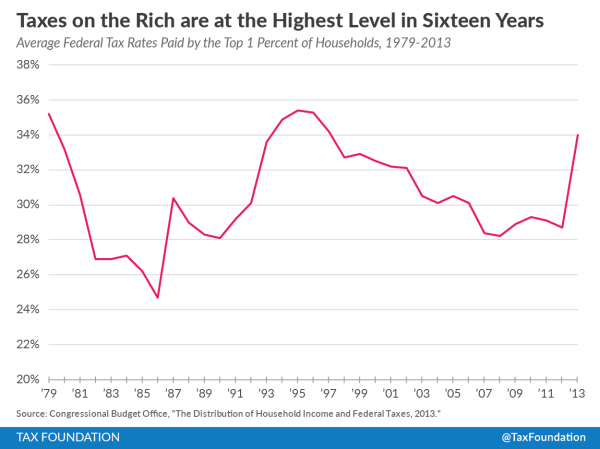
One of the main takeaways from this year’s report is that the richest Americans pay a lot in taxes. In 2013, the top 1 percent of households paid an average of 34.0 percent of their income in federal taxes. To compare, the middle 20 percent of households paid only 12.8 percent of their income in taxes. Moreover, taxes on the rich are much higher than they’ve been in recent years. …in 2013, the top 1 percent of taxpayers paid a higher tax rate (34.0 percent) than in the year President Reagan took office (33.2 percent).
And here’s the chart accompanying their analysis.

