I’m a big fan of fiscal data.
In part this is because I’m a policy wonk, but I also like budget numbers because they generally provide strong evidence for my philosophical belief in small government and spending restraint.
For instance, I enjoy sharing my table showing nations that have experienced great success with multi-year limits on spending growth, particularly since I enjoy putting my leftist friends in an uncomfortable position by asking them for a similar list of countries that have made progress by raising taxes (hint: that’s called the null set).
Given my affinity for budget data, I was excited to learn that the Joint Economic Committee (JEC) just released “An Economic History of Federal Spending and Debt.”
This new publication is filled with fiscal information starting in the late 1700s.
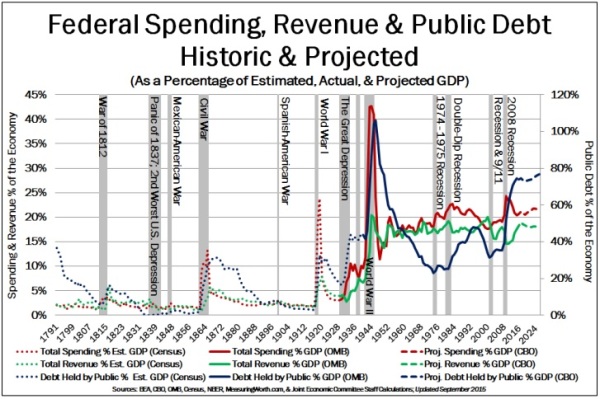
To give you an indication, check out this chart which, in one fell swoop, provides more than 200 years of data on spending, revenue, and debt, along with information on major wars and economic dislocations.

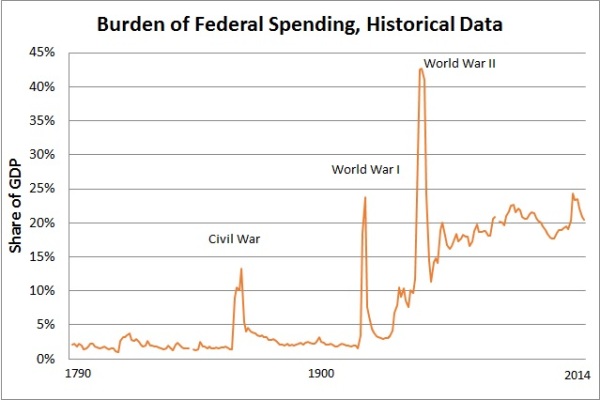
Since that’s an intimidating amount of information, I thought it might be a good idea to break out the most important set of numbers in that chart.
But I warn you that I’m not about to share good news. This chart shows how peacetime federal spending dramatically expanded during the 20th century.

Since I’ve already decided that data on dependency in Denmark was the most depressing powerpoint slide in the world, I guess we’ll call this the most tragic chart in the world.
Especially since it symbolizes a very unfortunate change in the attitude about the proper role of the federal government.
A progressive philosophical shift in federal spending began under President Woodrow Wilson. …George Will—writing on Wilson’s underlying philosophy—succinctly contrasted Wilson with James Madison by noting, “Wilsonian government, meaning (in Wilson’s words) government with ‘unstinted power,’ is hostile to Madison’s Constitution, which, Madison said, obliges government ‘to control itself.’”
In other words, the left decided that government was a force for progress rather than a threat to liberty, so they wanted to undermine the Constitution’s limits on the federal government.
And once the Supreme Court acquiesced to this perversion of the Constitution’s clear intent, any limits of federal power were swept away (evinced most recently by John Roberts’ tortured Obamacare decision).
And if you want to feel even sadder, check out the projections showing that America will become Greece in the absence of genuine entitlement reform.
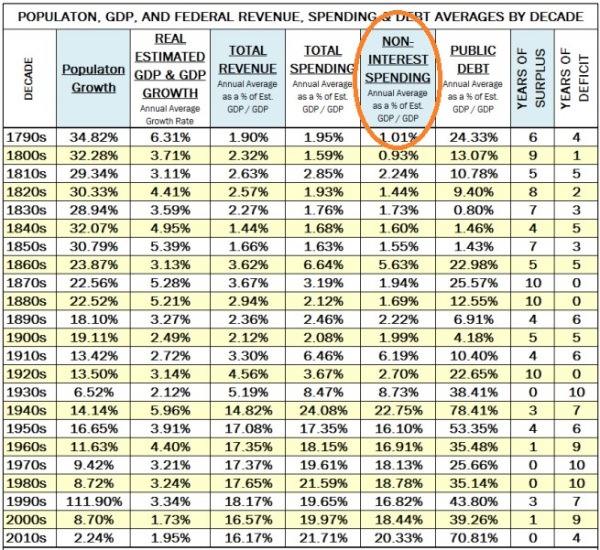
Here’s a table from the JEC report that shows how bad attitudes, bad jurisprudence, and bad policy have led to a dramatic expansion in the burden of government spending. The most important column, which I’ve circled, shows that we used to have a very small federal government that consumed, on average, less than 3 percent of economic output. But now we have a Leviathan that diverts more than 20 percent of GDP to Washington programs.

The report isn’t just numbers. There’s also some very useful analysis.
For instance, it notes that FDR’s New Deal did not work (as I’ve repeatedly explained, though it also should have acknowledged that Hoover made the same mistakes).
On balance, empirical research provides little support for the contention that President Franklin D. Roosevelt’s Keynesian policies helped to pull the United States out of the Great Depression.
It also makes important points about the economic impact of government spending.
While more spending and a bigger federal government can mean more federal jobs, these jobs come at the expense of private sector resources, meaning fewer private sector jobs and lost economic opportunities. …there is an inverse relationship between federal spending and private payroll employment.
And it echoes arguments that I’ve made about the progress that was achieved during the Clinton years.
…though spending increased in real dollar terms during this period, as a percent of the economy, spending actually declined. In FY1995, non-interest mandatory spending equaled 9.75 percent of GDP and discretionary spending equaled 7.19 percent of GDP. In spite of the spending increases, by FY2001, mandatory spending amounted to only 9.56 percent of GDP and discretionary spending amounted to only 6.16 percent of GDP.
Perhaps most important, the study endorses Mitchell’s Golden Rule!
…a politically viable path to a balanced budget and fiscal stability: Restrain the growth in federal spending below the rate of economic growth, and a sustainable fiscal environment will follow.
Last but not least, it endorses a spending cap modeled after the Swiss Debt Brake.
The ideal base for a spending cap would be similar to a GDP-cap, but it would provide greater spending restraint in economic booms and greater flexibility in economic downturns. Fortunately, such a measurement, which helps to smooth the business cycle, does exist: Potential GDP. …basing a spending cap on potential GDP is very helpful for budgeting purposes, as it creates a more predictable budget path over an extended period of time.
There is a lot of additional information in the JEC report, so if you have any interest in America’s fiscal history, it’s worth your time to read the whole thing.
