What’s the relationship between the Rahn Curve and the Laffer Curve?
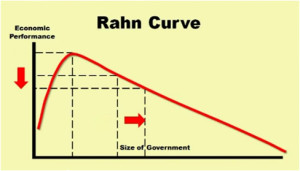
For the uninitiated, the Rahn Curve is the common-sense  notion that some government is helpful for prosperous markets but too much government is harmful to economic performance.
Even libertarians, for instance, will acknowledge that spending on core “public goods” such as police protection and courts (assuming, of course, low levels of corruption) can enable the smooth functioning of markets.
Some even argue that government spending on human capital and physical capital can facilitate economic activity. For what it’s worth, I think that the government’s track record in those areas leaves a lot to be desired, so I’d prefer to give the private sector a greater role in areas such as education andhighways.
The big problem, though, is that most government spending is for programs that are often categorized as “transfers” and “consumption.” And these are outlays that clearly are associated with weaker economic performance.
This is why small-government economies such as Hong Kong and Singapore tend to grow faster than the medium-government economies such as the United States and Australia. And it also explains why growth is even slower is big-government economies such as France and Italy.
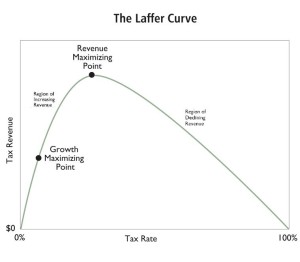
The Laffer Curve,  for those who don’t remember, is the common-sense depiction of the relationship between tax rates and tax revenue.
The essential insight is that taxable income is not fixed (regardless of the Joint Committee on Taxation’s flawed methodology).
When tax rates are low, people will earn and report lots of income, but when tax rates are high, taxpayers figure out ways of reducing the amount of taxable income they earn and report to government.
This is why, for instance, the rich paid much more to the IRS after Reagan lower the top tax rate from 70 percent to 28 percent.
So why am I giving a refresher course on the Rahn Curve and Laffer Curve?
Because I’ve been asked on many occasions whether there is a relationship between the two concepts and I’ve never had a good answer.
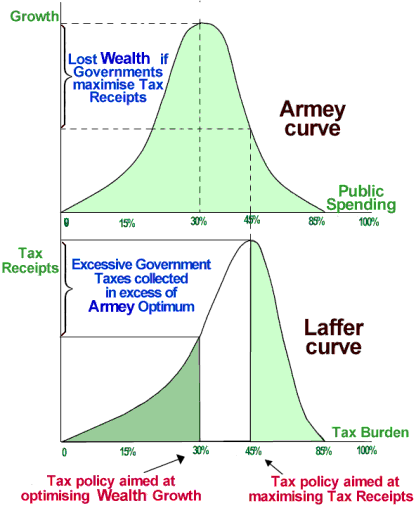
But I’m happy to call attention to the good work of other folks, so here’s a very well done depiction of the relationship between the two curves (though in this case the Rahn Curve is called the Armey Curve).

I should hasten to add, by the way, that I don’t agree with the specific numbers.
I think the revenue-maximizing rate is well below 45 percent and I think the growth-maximizing rate is well below 30 percent.
But the image above is spot on in that it shows that a nation should not be at the revenue-maximizing point of the Laffer Curve.
Since I’m obviously a big fan of the Rahn Curve and I also like drawing lessons from cross-country comparisons, here’s a CF&P video on that topic.
My only real complaint (and this will sound familiar) is that I’m uneasy with the implication around the 1:45 mark that growth is maximized when government spending consumes 25 percent of economic output.
This implies, for instance, that government in the United States was far too small in the 1800s and early 1900s when the overall burden of government spending was about 10 percent of GDP.
But I suppose I’m being pedantic. Outlays at the national, state, and local level in America now consume more than 38 percent of economic output according to the IMF and we’re heading in the wrong direction because of demographic changes and poorly designed entitlement programs.
So if we can stop government from getting bigger and instead bring it back down to 25 percent of GDP, even I will admit that’s a huge accomplishment.
Libertarian Nirvana would be nice, but I’m more concerned at this point about simply saving the nation from becoming Greece.
