I’m in Vancouver, Canada, for the biennial meeting of the World Taxpayers Associations.
I gave a speech on why tax competition is a valuable force to constrain the greed of the political class, but warned the audience that high-tax governments and international bureaucracies are using financial protectionism to coerce low-tax jurisdictions into weakening their good policies.
But regular readers know that I pontificate far too often on that topic, so today’s column is instead about a presentation by Michael Walker, who was the founding Executive Director at Canada’s Fraser Institute.
Michael’s great contribution to the world was the creation of the Economic Freedom of the World Index, which he developed working with scholars such as Milton Friedman.
I’ve cited the EFW Index many times, particularly to bemoan how America’s score has deteriorated during the Bush-Obama years.
Today, though, we’re going to look at global trends in economic freedom, using some of the slides from Michael’s presentation. And the good news, as you can see from the green line in this first chart, is that there was a significant increase in economic freedom between 1980 and 2010.
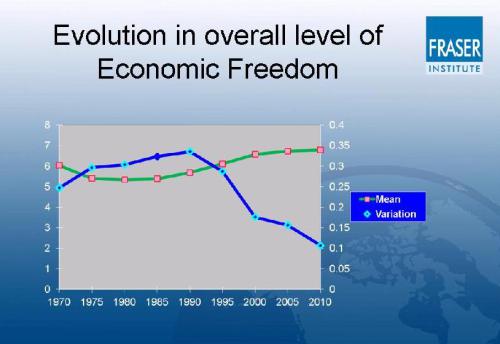
The blue line, by the way, shows how much nations differed. A higher blue line means more variation (in other words, some nations with very good scores and some with very bad scores), while a lower blue lines means that nations are converging.
To really understand what’s happening, however, it’s important to look at the component parts of the EFW Index. As I wrote back in 2012:
…a country’s economic performance is governed by a wide range of policies.
Indeed, the research suggests that there are five big factors that determine prosperity, and they’re all equally important.
Rule of law and property rights
Sound money
Fiscal policy
Trade policy
Regulatory policy
So let’s look at what’s been happening in each of these areas. Keep in mind, as we look at the following charts, that 10 is the best score.
We’ll start with fiscal policy. As you can see, policy was moving in the wrong direction from 1970 to 1985, then we got two decades of pro-growth changes, but now policy is again trending in the wrong direction.
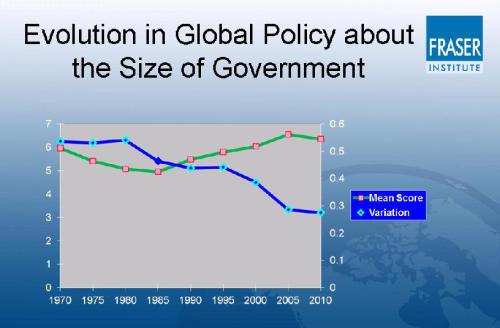
We’re still better off than we were 30 years ago, but I’m afraid scores will continue to decline because tax rates are now heading in the wrong direction and the burden of government spending is rising in many nations.
Now let’s look at the regulatory data. The trend may not be dramatic, but it is positive. The green line is gradually rising, showing that governments are easing red tape and reducing intervention.
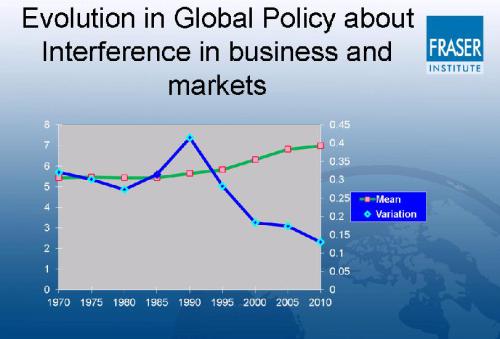
Moreover, there’s no sign that policy is moving in the wrong direction, at least on a global basis.
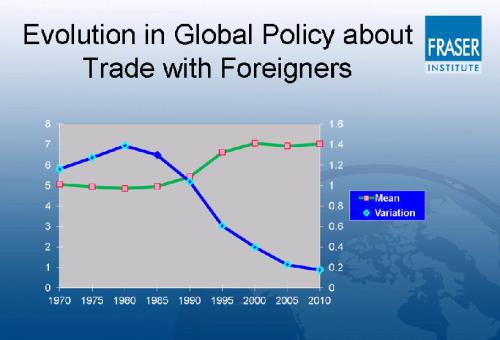
Shifting to trade, we have perhaps the biggest success story in global economic policy. Between 1980 and 200, there was a dramatic increase in the freedom to trade.
We also see some progress on monetary policy, both in that it stopped moving in the wrong direction in 1975 and then moved in the right direction beginning in 1995.
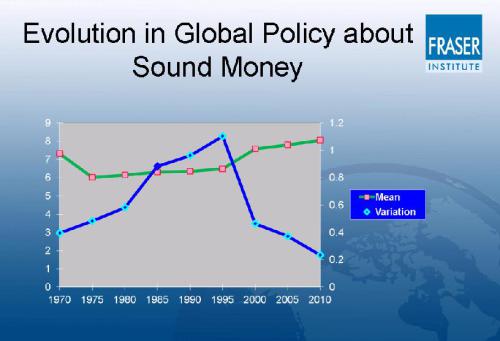
Though I confess some skepticism about this measure. Central banks have created a lot of problems with excess liquidity, but they generally escape blame so long as easy-money policies don’t result in higher consumer prices.
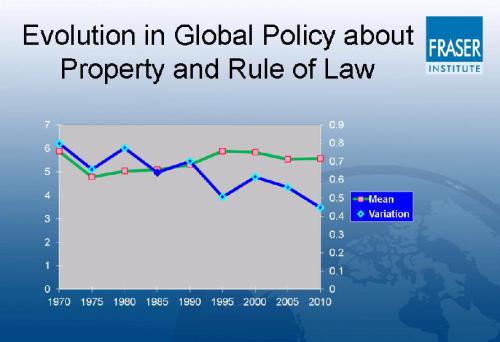
This brings us to our final category. Property rights and the rule of law are very important for market economies, but unfortunately we’ve seen no long-run improvement in these key measures. Positive change between 1975 and 1995 is offset by movement in the wrong direction at other times.
 Indeed, if we look at this next chart, which measures the distribution of scores for each category in 2010, you’ll see that nations get their lowest scores on rule of law and property rights.
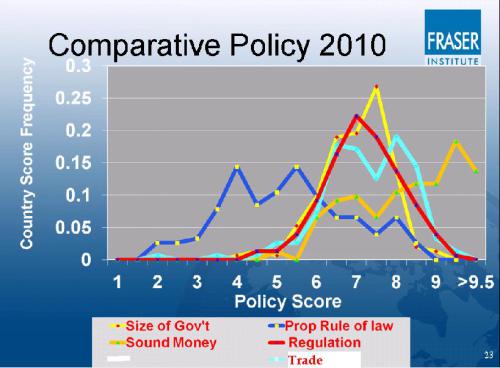
This aggregate data, while very useful, does not tell the entire story. If you look at various regions, you’ll discover that “first world” nations tend to get decent scores on rule of law and property rights while developing nations get poor scores.
Indeed, this is why the blue line in the rule of law/property rights chart is so much higher than it is for other categories. Simply stated, this is one area where there hasn’t been much convergence.
Which is a big reason why many developing nations are economic laggards, even if they get reasonably good scores in other categories.
Here’s a final chart that emphasizes that point. It shows nations that get the best scores on the size of government (left column), but then shows that many of them get very poor scores for rule of law and property rights (right column).
The fiscal burden of government is very low in nations such as Lebanon and Bangladesh, for instance, but these jurisdictions don’t attract a lot of investment or enjoy much growth because government fails to provide the right environment.
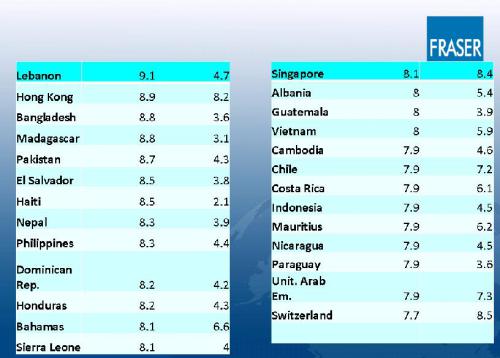
All of which shows why Hong Kong, Singapore, and Switzerland deserve special praise. They have strong rule of law and property rights while simultaneously maintaining reasonable limits on the fiscal burden of the public sector. No wonder they are ranked first, second, and fourth in overall economic freedom.
And it’s worth noting that a few other nations deserve honorable mention for getting good fiscal policy scores while doing a decent job on the rule of law and property rights, specifically Bahamas (#39), Chile (#11), Mauritius (#6), and United Arab Emirates (#5).
By the way, the United States only got a 6.4 for size of government and a 7.1 for rule of law and property rights. No wonder America is only #17 in the overall rankings.
Back in 2000, when the United States ranked #3, we got a 7.0 for size of government and a 9.2 for rule of law and property rights.
So now you now know why I complain so much about Bush and Obama. And you especially know why I’m so concerned about the erosion of the rule of law under Obama.
