I got involved in a bit of a controversy last year about presidential profligacy.
Some guy named Rex Nutting put together some data on government spending and claimed that Barack Obama was the most frugal President in recent history.
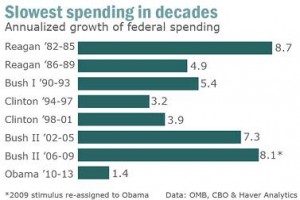 I pointed out that Mr. Nutting’s data left something to be desired because he didn’t adjust the numbers for inflation.
Moreover, most analysts also would remove interest spending from the calculations since Presidents presumably shouldn’t be held responsible for servicing the debt incurred by their predecessors.
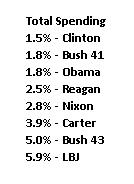 But even when you make these adjustments and measure inflation-adjusted “primary spending,” it turns out that Nutting’s main assertion was correct. Obama is the most frugal President in modern times.
When you look at the adjusted numbers, though, Reagan does a lot better, ranking a close second to Obama.
I also included Carter, Nixon, and LBJ in my calculations, though it’s worth noting that none of them got a good score. Indeed, President Johnson even scored below President George W. Bush.
Some of you may be thinking that I made a mistake. What about the pork-filled stimulus? And all the new spending in Obamacare?
Most of the Obamacare spending doesn’t begin until 2014, so that wasn’t a big factor. And I did include the faux stimulus. Indeed, I even adjusted the FY2009 and FY2010 numbers so that all of stimulus spending that took place in Bush’s last fiscal year was credited to Obama.
So does this mean Obama is a closet conservative, as my misguided buddy Bruce Bartlett has asserted?
Not exactly. Five days after my first post, I did some more calculations and explained that Obama was the undeserved beneficiary of the quirky way that bailouts and related items are measured in the budget.
It turns out that Obama supposed frugality is largely the result of how TARP is measured in the federal budget. To put it simply, TARP pushed spending up in Bush’s final fiscal year (FY2009, which began October 1, 2008) and then repayments from the banks (which count as “negative spending”) artificially reduced spending in subsequent years.
And when I removed TARP and other bailouts from the equation, Obama plummeted in the rankings. 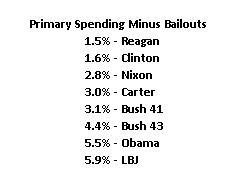 Instead of first place, he was second-to-last, beating only LBJ.
But this isn’t the end of the story. My analysis last year only looked at the first three years of Obama’s tenure.
We now have the numbers for his fourth year. And if you crank through the numbers (all methodology available upon request), you find that Obama’s numbers improve substantially.
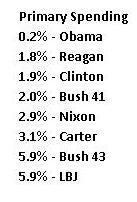 As the table illustrates, inflation-adjusted non-interest spending has grown by only 0.2 percent per year. Those are remarkably good numbers, due in large part to the fact that government spending actually fell in nominal terms last year and is expected to shrink again this year.
We haven’t seen two consecutive years of lower spending since the end of the Korean War!
Republicans can argue, of course, that the Tea Party deserves credit for recent fiscal progress, much as they can claim that Clinton’s relatively good numbers were the result of the GOP sweep in the 1994 elections.
I’ll leave that debate to partisans because I now want to do what I did last year and adjust the numbers for TARP and other bailouts.
In other words, how does Obama rank if you adjust for the transitory distorting impact of what happened during the financial crisis?
Well, as you can see from this final table, Obama’s 2013 numbers are much better than his 2012 numbers. 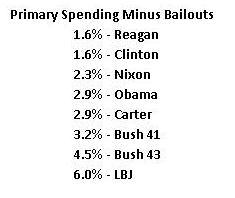 Instead of being in second-to-last place, he’s now in the middle of the pack.
I used a slightly different methodology this year to measure the impact of TARP and related items, so all of the numbers have changed a bit, but Reagan is still the champ and everyone else is the same order other than Obama.
So what does all this mean?
As I constantly remind people, good fiscal policy occurs when the burden of government spending is falling as a share of economic output.
And this happens when policy makers follow my Golden Rule and restrain spending so that it grows slower than the private economy.
That’s actually been happening for the past couple of years. Even after you adjust for the quirks of how TARP repayments get measured.
I’m normally a pessimist, but if advocates of small government can maintain the pressure and get some concessions during the upcoming fights over spending levels for the new fiscal year and/or the debt limit, we may even see progress next year and the year after that.
And if we eventually get a new crop of policymakers who are willing to enact genuine entitlement reform, the United States may avoid the future Greek-style fiscal crisis that is predicted by the BIS, OECD, and IMF.
That would almost be as good as a national championship for the Georgia Bulldogs!
