April 2007, Vol. VII, Issue V
The Iceland Tax System:
Key features and lessons for Policy Makers
Iceland’s economic renaissance is an impressive story. With lower tax rates leading the way, significant reforms have liberalized the economy, spurring growth and improving competitiveness. The shift in policy is noteworthy since Iceland experienced a period of misguided government policy. During the 1980s, the country suffered from an unstable currency, with the inflation rate routinely and consistently running at double-digit levels – and, for a few months, exceeding 100 percent on an annual basis.1 The aggregate tax burden rose steadily, climbing from 26.2 percent of GDP in 1965 to about 40 percent today.2 A value-added tax was adopted without the concomitant elimination of other taxes.3
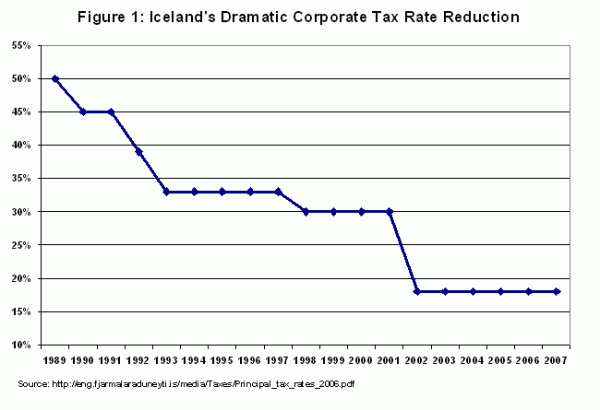
Market-oriented tax policy has played a key role in Iceland’s rebirth. Major tax reforms include slashing the corporate tax rate from 50 percent to 18 percent, abolition of the wealth tax, a low-rate 10 percent flat tax on capital income, and an intermediate-rate 36 percent flat tax on labor income. These supply-side reforms, along with policies such as privatization and deregulation, have yielded predictable results. Incomes are rising, unemployment is almost nonexistent, and the government is collecting more revenue from a larger tax base.
By Hannes Gissurarson, Ph.D. and Daniel J. Mitchell, Ph.D.
THE TAX SYSTEM – AN OVERVIEW
Key Features:
- Iceland is not a low-tax economy. The aggregate tax burden in Iceland is about 40 percent of GDP, slightly lower than most other European nations, but significantly higher than jurisdictions such as the United States and Hong Kong.
- Iceland has a flat tax on labor income, which took effect for income earned in 2006, but the rate is nearly 36 percent.
- Iceland also has a flat tax on capital income, with a low rate of just 10 percent.
- Taxpayers have a zero-tax threshold that enables them to protect a substantial share of income from tax.
- Iceland has a 24.5 percent value-added tax, though certain items are taxed at lower rates.
- Iceland’s corporate tax rate is 18 percent.
- The death tax is only 5 percent.
- Payroll taxes are a modest burden. The rate is slightly more than six percent.
- Iceland has a territorial tax regime, meaning companies generally are not double-taxed on income earned in other nations.
Key Observations:
- Iceland is now the world’s fifth-richest nation according to both the International Monetary Fund and the Organisation for Economic Cooperation and Development.
- Iceland now ranks as the world’s 9th freest economy according to Economic Freedom of the World and the 15th freest economy according to the Index of Economic Freedom.
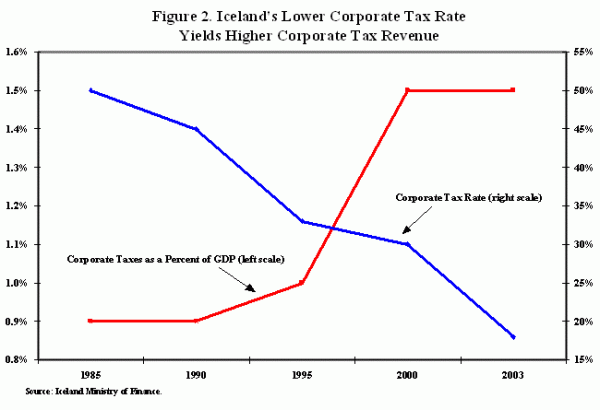
- Lower tax rates have generated a supply-side feedback effect. The government is collecting substantially more corporate tax revenue with a rate of 18 percent instead of 50 percent. Revenues from the 10 percent tax on capital income also have been robust.
- Iceland has implemented sweeping economic reforms. In addition to tax reform, the island nation has implemented personal retirement accounts, created property rights for fisheries, and privatized numerous state-owned industries.
A Closer Look at the Tax System
Iceland is not a low-tax economy. Taxes consume about 40 percent of economic output, substantially higher than nations such as America, Ireland, and Hong Kong. Compared to most European nations, however, Iceland’s tax burden is not onerous – especially when comparing tax rates on productive activity. Tax rates on labor income are modest, with only five other OECD nations imposing a top tax rate that is lower than the 36.7 percent rate imposed in Iceland.4
The corporate tax rate ranks even better. At 18 percent, only Hungary (16 percent) and Ireland (12.5 percent) have lower corporate rates than Iceland.5 Equally impressive, Iceland has a low-rate flat tax of 10 percent on dividends, interest, and capital gains. Payroll taxes also are modest, with a tax rate of six percent. The value-added tax, by contrast, is steep, with a rate of 24.5 percent.
Supply-Side Reforms
Learning from the experiences of other countries, Iceland has adopted a series of pro-growth tax reforms, particularly under the leadership of David Oddsson, who served as Prime Minister between 1991 and 2004. The government began with corporate rate reductions in the early 1990s. Policy makers then addressed the personal income tax in the late 1990s, lowering rates and reducing the tax burden on capital income. More recently, the government has eliminated the wealth tax and implemented a flat tax. These policies were well designed, focusing on reducing marginal tax rates on productive behavior.
Even though tax rates were substantially reduced, the reforms did not reduce the aggregate tax burden. Indeed, taxes today consume about 40 percent of GDP, a large increase compared to 1991, when taxes amounted to 32 percent of GDP. This seeming paradox – lower tax rates and higher tax revenue – indicates a strong “Laffer Curve” effect. In other words, lower tax rates in many cases are generating more revenue. In 1990, before personal and corporate income tax rates were reduced, revenues from taxes on income and profits collected a bit more than 9 percent of GDP. Today, with tax rates significantly lower, these revenues sources consume close to 18 percent of economic output.6 As discussed below, this Laffer Curve effect has been especially pronounced for the corporate income tax and low-rate flat tax on capital income.
i) Slashing the corporate income tax rate
As recently as 1989, Iceland had a punitive 50 percent corporate tax rate. As shown in Figure 1, the government began to reduce the tax rate in the early 1990s. A series of rate reductions dropped the burden down to 33 percent. The rate was modestly reduced to 30 percent in the late 1990s, and then slashed to 18 percent in 2002. The tax rate on partnership income also was slashed, dropping from 50 percent to 26 percent over the same time period.7
Much like Ireland, the low corporate tax rate in Iceland yielded positive results. Economic growth has been robust, financial markets are strong, and unemployment is almost nonexistent. Skeptics worried that the low corporate rate would deprive the government of revenue, but Iceland’s corporate rate reduction generated substantial revenue feedback. As illustrated by Figure 2, the Laffer Curve even applies near the Arctic Circle.
ii) Reducing income tax rates and adopting a flat tax
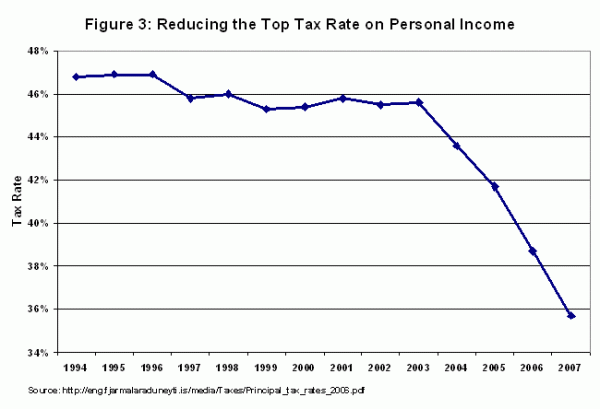
Iceland has a national income tax and a local (or municipal) income tax. All municipalities levy local income taxes, and the rate is almost identical across the country. For all intents and purposes, the combined rate is therefore the relevant burden for all taxpayers. In the mid-1990s, the maximum combined tax rate on personal income was nearly 47 percent, and even taxpayers with more modest incomes faced a marginal tax rate of nearly 42 percent – and the rate had been trending higher.8
As seen in Figure 3, the government decided to reverse course and began to steadily reduce the top tax rate. Between 1996 and 2007, the combined top tax rate dropped by more than 11 percentage points, falling from nearly 47 percent to less than 36 percent. The central government rate actually dropped by about 15 percentage points, but an increase in the local income tax rate meant the net reduction was about 11.2 percentage points. Equally significant, the government began to reduce the surtax that applied to upper-income taxpayers. Since the gap between the top rate and the basic rate was never more than 7 percentage points, the system was not harshly progressive. Nonetheless, the government lowered the rate every year starting for income earned in 2003, leading to its abolition for income earned in 2006.
Although the elimination of the surtax received very little attention, Iceland now is a member of the flat tax club. To be sure, a flat tax of almost 36 percent is less than inspiring. Indeed, Iceland’s flat tax rate is higher than the top rate in America’s five-bracket tax system (though the comparison is more favorable for Iceland if the central government’s flat tax rate of 22.75 percent is the benchmark). In any event, a single-rate tax system is remarkable for two reasons. First, it does reflect a continued effort to reduce marginal tax rates on productive behavior. But second, and perhaps even more important, policy makers in Iceland decided that it was no longer politically desirable to discriminate against more productive taxpayers.
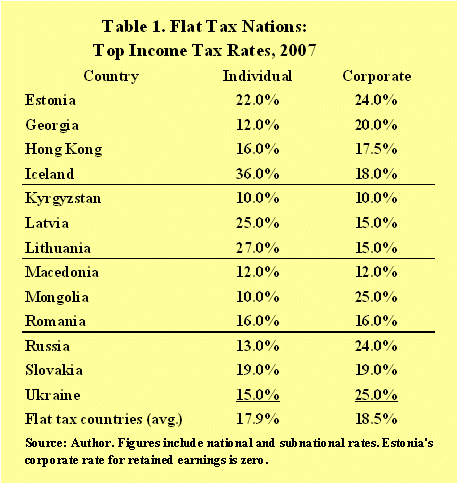
Ideally, officials in Iceland now will concentrate on reducing the rate of Iceland’s flat tax. As seen in Table 1, there are nearly 20 jurisdictions with flat tax system – and all of them have rates far below Iceland’s rate of nearly 36 percent. None of these flat tax systems is faithful to the theoretical ideal outlined by Professors Hall and Rabushka (though the tax regimes in Hong Kong, Estonia, and Slovakia deserve credit for having well-designed systems that come close to the pure model), but at least there unambiguously is a trend toward lower tax rates. Not only are most of recent members of the flat tax club choosing low rates (Mongolia and Kyrgyzstan chose 10 percent rates, while Macedonia picked 12 percent), but nations that adopted the flat tax in the mid-1990s (such as the Baltic nations of Estonia, Latvia, and Lithuania) are in the process of lowering their flat tax rates to retain their competitiveness.9
iii) Low-rate flat tax on capital income
An ideal tax system does not penalize income that is saved and invested. That is why reforms such as the flat tax eliminate all forms of double-taxation. Iceland has taken an important step in this direction by adopting a low-rate tax of 10 percent on capital income. Prior to 1997, Iceland generally subjected capital income to personal income tax rates, which meant that dividends and capital gains were being taxed at rates of more than 40 percent – even though the income already was taxed at least once when first earned (though interest income was free from double-taxation).
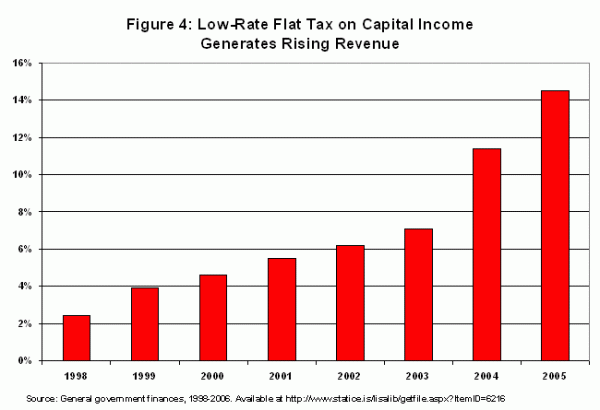
The low 10-percent rate in the new system sharply reduces the tax code’s bias against capital. Individuals no longer are being heavily penalized for deferring consumption and providing capital to the Icelandic economy. Much like the lower tax rates on corporate income and personal income, the flat-rate tax on capital income is associated with strong growth and increased competitiveness. It also is generating considerable revenue for the Treasury. Figure 4 shows how revenues have jumped in the years since the low-rate flat tax on capital income was enacted.
iv) Abolishing the wealth tax and implementing a low-rate 5 percent death tax
Joining other nations such as Sweden, Netherlands, Finland, and Denmark, Iceland abolished its tax on net wealth.10 The repeal of the wealth tax was a two-stage process. Prior to 2003, the tax rate was 1.45 percent.11 It was reduced that year to 0.6 percent, and then fully abolished at the end of 2005. There was resistance to abolishing the wealth tax. Supporters argued that the rate was modest, and a 1.45 percent tax rate sounds low, but it meant a high effective tax on capital income depending on how much of a return the assets were earning. For instance, if a taxpayer’s net wealth increased by 5 percent, a wealth tax of 1.45 percent is akin to a 29 percent tax on the 5 percent annual return.
This resulted in very harsh treatment of income that was saved and invested, especially prior to the 1997 reform that ended the punitive 40 percent-plus tax that applied to most forms of capital income. But even after the 10 percent flat tax on capital income was instituted, the wealth tax still resulted in distortionary tax rates on capital. In years when financial markets were weak or economic conditions faltered, the effective marginal tax rate could climb to confiscatory levels. Moreover, the tax raised less than 2 percent of revenue, a small amount for a tax capable of imposing serious economic costs.12 The decision to repeal the wealth tax moved Iceland another step closer to a system that taxes income only one time.
In addition to wealth tax repeal, Iceland reduced its death tax rate for bequests to immediate heirs to a low level of 5 percent. Since the rate was only 10 percent prior to reform, this low rate does not represent a dramatic change. Nonetheless, any reduction in this perverse form of double-taxation is a positive step. Income should be taxed once when first earned. Taxing the transfer of after-tax income, solely because of a death, is both morally and economically misguided.
Other Pro-Market Policies
Better tax policy certainly is an important characteristic of Iceland’s economic reform, but the government has made improvements in other areas as well. Inflation was a serious problem in the 1980s, with prices rising by double-digit percentages every year – including a one-year increase of 84.3 percent in 1983.13 To reverse this debilitating trend, the central bank was granted independence and the currency was allowed to float.14 These reforms, which dramatically improved incentives for sound money, have been very successful. The double-digit inflation that was common in the 1980s is no longer a problem.
Another important reform occurred in the pension system. Like most nations, Iceland had a pay-as-you-go retirement system that faced fiscal challenges and discouraged labor supply. Today, Iceland has a private retirement system, which is a combination of a defined benefit system and a defined contribution system. Including the so-called employer share, workers pay 12 percent of their wages into this funded system.15 The system, which can be traced back to the late 1960s and was reformed in 1997, pays inflation-adjusted benefits upon age 67 (65 for government workers).16 From a fiscal perspective, the system is a big success. The Organisation for Economic Cooperation and Development has remarked that “ageing-relating public expenditure is seen to be moderate due in part to the country’s occupational pension system having become fully funded.”17
Iceland also has engaged in widespread privatization. The privatized industries include investment banking, commercial banking, contracting, Internet service, fish-processing, pharmaceuticals, energy, retail stores, fertilizer, travel agencies, and telecom. Selling companies to the private sector simultaneously improved economic efficiency and generated revenues to help finance pro-growth tax cuts and debt reduction.18
Perhaps the most interesting privatization was the step taken to conserve fish stocks and enhance the fishing industry’s long-term viability. Concerned that over-fishing was depleting stocks, Iceland quasi-privatized fisheries beginning in 1984. This novel system, based on individual fishing quotas, solved the “tragedy of the commons” and ensures sustainable yields.19 This system now is seen as a model elsewhere in the world.
Last but not least, Iceland deregulated. As the OECD noted, “Most of the rise in trend growth reflects productivity gains following the implementation of widespread structural reforms, which opened the economy and enhanced competition.”20 In other words, policy makers put resources back in private hands, lowered tax rates to encourage productive behavior, and unshackled entrepreneurs to meet the needs of Iceland’s citizens.
Positive Results
Free market reforms have yielded considerable dividends. Iceland is now the world’s fifth richest nation according to the International Monetary Fund, exceeded only by the tax haven of Luxembourg, oil-rich Norway, the United States, and tax-cutting Ireland. It has enjoyed annual growth averaging 4.3 percent between 1995 and 2005, a performance in the developed world exceeded only by Ireland, Luxembourg, and South Korea (Slovakia, with a 19 percent flat tax, ties Iceland with 4.3 percent average growth over the same ten-year period).21
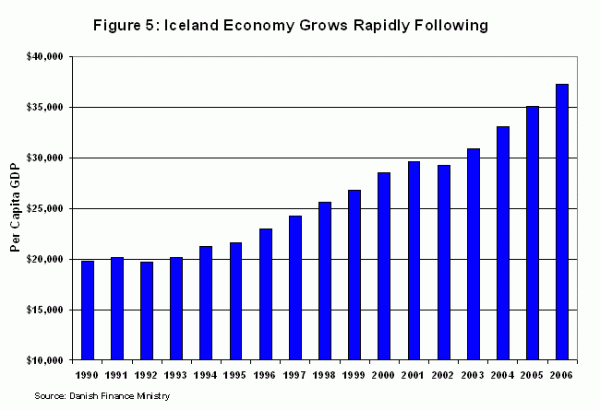
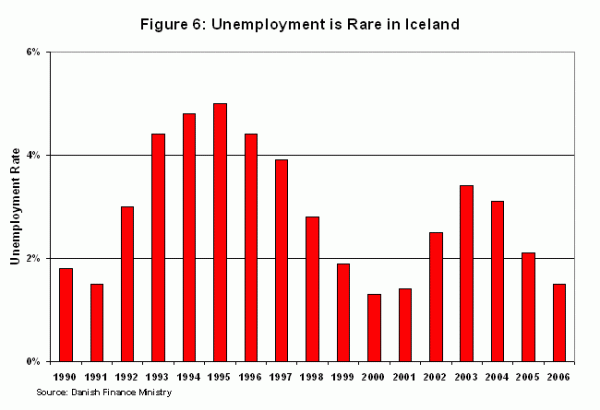
Traditional economic theory presupposes that rich nations are supposed to grow less rapidly than poor countries, so it is especially noteworthy that Iceland is both wealthy and rapidly growing. Residents of Iceland have gained from their country’s economic renaissance. As illustrated by Figure 5, per capita GDP climbed significantly once reforms began to take effect. Unemployment is almost nonexistent. Figure 6 shows that the jobless rate always has been reasonable, especially compared to most European nations, but an unemployment rate of less than 2 percent is truly remarkable.
Iceland’s growth has been particularly impressive in recent years, 8.2 percent in 2004, 5.5 percent in 2005, and 4.0 percent last year.22 Clearly, Iceland’s economic reforms have substantially boosted the nation’s long-term potential.
This stellar performance is reflected in global rankings. The World Economic Forum ranks Iceland 14th out of a list of 125 countries.23 The International Institute for Management Development puts Iceland 4th out of 61 nations in the rankings.24 Forbes’ Capital Hospitality Index puts Iceland 22nd out of 144 nations.25 As mentioned previous, Economic Freedom of the World ranks Iceland as the world’s 9th freest economy. What is particularly impressive, though, is that Iceland’s score has jumped from 4.2 out of 10 in 1975 to 7.9 in 2004.26 The Index of Economic Freedom, meanwhile, ranks Iceland 15th in its annual guide, noting:
Iceland enjoys high levels of freedom from corruption, investment freedom, trade freedom, financial freedom, property rights, business freedom, fiscal freedom, and monetary freedom. A point of pride is that Iceland is rated as the world’s least corrupt economy. …Virtually all commercial operations are simple and transparent. Inflation is fairly low, and foreign investment is permitted without government approval, although capital is subject to restrictions in some areas of the economy. Iceland’s financial sector is highly modern. The judiciary, independent of politics and free of corruption, has an exemplary ability to protect property rights. …In per capita terms, it is one of the world’s wealthiest economies. Recent market liberalization and a considerable reduction in government ownership have strengthened entrepreneurial dynamism and increased productivity in many sectors of the economy.27
Iceland is successful even by the standards of international bureaucracies that tend to be obsessed with fiscal balance rather than economic freedom. The Organization for Economic Cooperation and Development concludes that “Iceland’s economy and per capita income have grown at an impressive pace” and also reports that government debt in 2006 was just 10.8 percent of GDP.28 International Monetary Fund, meanwhile, notes that “the medium-term outlook for the Icelandic economy remains highly favorable” and that Iceland’s government debt is both “low and declining.”29
Interestingly, neither of these international bureaucracies acknowledges the important link between lower tax rates, economic growth, and declining debt levels. This may be because of institutional biases. The IMF frequently advises governments to raise taxes to improve fiscal balance and lower debt levels, so Iceland provides an inconvenient example of an alternative approach. The OECD, meanwhile, is infamous for its anti-tax competition project, so it has little reason to highlight a nation that prospers – and reduces its debt – by lowering tax rates.
Regardless of whether the IMF and OECD have misguided motives, or just bad judgment, Iceland’s supply-side tax rate reductions are a success. The tax rate reductions have resulted in faster growth – and fiscal balance is a byproduct of better economic performance. Faster growth means a bigger tax base and healthy revenue collections. Faster growth also means more GDP, which automatically reduces the debt/GDP ratio.
Remaining Challenges
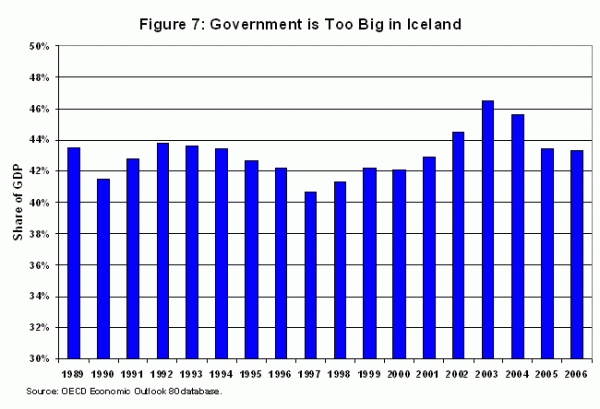
While Iceland must be considered an economic success story, the country is not a free-market Mecca. The aggregate burden of government remains very high. Figure 7 shows that government spending consumes more than 43 percent of national economic output. Moreover, there is no sign that Iceland’s policy makers are looking for ways to shrink the burden of government. Yet even the OECD, which is not known for advocating limited government, has told Icelandic policy makers that, “to strengthen the medium-term orientation of expenditure policy and control, the introduction of multi-year budget plans should be considered, with spending limits set to rigorously limit real spending growth, but then made binding in nominal terms.”30
When compared to countries like Sweden and Denmark, tax rates are not as high and government spending consumes a smaller share of GDP.31 Nonetheless, Iceland is still a traditional Nordic welfare state. Depending on the comparison, this is either good news or bad news. The good news is that the “Nordic Model” is better than the dirigisme approach of continental welfare states such as France and Germany. The Nordic Model is premised on the combination of substantial income redistribution and laissez-faire policies in almost all areas other than fiscal policy. Nations such as France and Germany, by contrast, choose the worst possible option: a large welfare state with significant amounts of government intervention and regulation. This is why Nordic nations tend to out-perform most other European countries.
The bad news is that a large welfare state – even when combined with laissez-faire policies – is inconsistent with rapid economic growth. Iceland has enjoyed strong growth during its period of reform. But once these reforms are fully reflected in the economy, it is likely that the country’s trend growth will revert to a less impressive level. Indeed, the IMF’s intermediate projection is for growth to average less than 3 percent over the next five years.
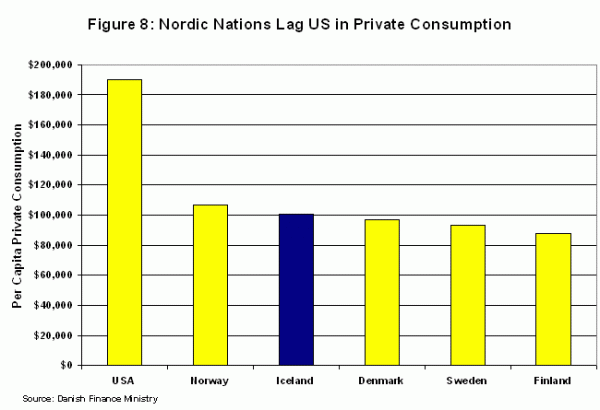
Laissez-faire policies in Nordic nations mitigate some of the damage associated with excessive government, thus permitting adequate growth levels, but even an “efficient” welfare state imposes a cost. The most important measure of well-being is the ability of people to enjoy high living standards. Because of high taxes, Nordic nations lag in this important measure. According to the Danish Finance Ministry, all Nordic nations lag far behind the United States. As seen in Figure 8, private consumption per capita is barely half the US level.32 An OECD study reached a similar conclusion, finding that disposable income per capita if far below the US level.33
There are presumably several factors that contribute to America’s higher economic ranking, but a key difference between America and the Nordic nations is the burden of government spending. The United States has a welfare state, but it is not as large. And since America generally follows laissez-faire policy in other areas, this creates a competitive advantage.
Conclusion
Government in Iceland used to play a pervasive role in economic decision-making. As a former Prime Minster explained:
…the Icelandic state was actively and extensively involved in business activities at that time. Nothing seemed beyond its scope. Running a travel agency, fish meal processing plants, a knitting workshop, a printing company and all manner of other enterprises was taken for granted. The crucial factor, however, was the iron grip that the Icelandic state had on all business activity through its ownership of the commercial banks.34
Even during its bleakest period, Iceland was not a poor country. Productive fisheries, low-cost geothermal energy, and a strong (and profitable) U.S. military presence were among the factors ensuring reasonable levels of prosperity. Yet policy makers realized that Iceland was performing below its potential. Economic reforms in other nations during the 1980s were influential in demonstrating that market-oriented policies were capable of improving economic efficiency, raising living standards, and improving competitiveness.
Subsequent reforms in Iceland, especially lower tax rates, have yielded big dividends. Iceland is a rich and successful nation. Lower tax rates and supply-side policies have boosted growth, increased efficiency, and made the country more competitive. The three biggest reforms are the low corporate tax rate, the low-rate flat tax on capital income, and the intermediate-rate flat tax on labor income. There already is considerable evidence that the first two reforms have been very successful. Indeed, it is quite likely that the lower rates have generated significant Laffer Curve effects.
The flat tax has only been in effect since 2006, so it is too soon to draw sweeping conclusions. Because of the relatively high 36 percent rate, this flat tax almost surely will not have a major effect on economic performance. The slight reduction in marginal tax rates will help the economy, but the real significance of the flat tax is that policy makers explicitly chose to end so-called progressive taxation. No longer are people disproportionately penalized for contributing more to Iceland’s wealth.
To solidify its gains and further improve competitiveness, Iceland’s policy makers should focus on two goals. First, they should seek to lower the rate of the flat tax. Other flat tax nations are taking this step to enhance competitiveness in a global economy. Iceland should learn from this experience. Second, Iceland officials should seek to reduce the size and burden of the public sector. Even an efficient tax system will be harmful to growth if it has to finance a government sector that is consuming more than 40 percent of the country’s economic output.
________________________________
Professor Hannes H Gissurarson is Professor of Politics at the University of Iceland. He is working on a book on the transformation of the Icelandic economy 1991-2007 (http://hannesgi.blog.is/blog/hannesgi/).
Daniel J. Mitchell is a Senior Fellow at the Cato Institute (www.cato.org).
________________________________
The Center for Freedom and Prosperity Foundation is a public policy, research, and educational organization operating under Section 501(C)(3). It is privately supported, and receives no funds from any government at any level, nor does it perform any government or other contract work. Nothing written here is to be construed as necessarily reflecting the views of the Center for Freedom and Prosperity Foundation or as an attempt to aid or hinder the passage of any bill before Congress.
Center for Freedom and Prosperity Foundation, the research and educational affiliate of the Center for Freedom and Prosperity (CFP), can be reached by calling 202-285-0244 or visiting our web site at www.freedomandprosperity.org.
________________________________
Endnotes
1 David Oddsson, “Iceland’s Economic Performance,” Address to the American Enterprise Institute, Washington, June 14, 2004, http://eng.forsaetisraduneyti.is/minister/speeches-and-articles/nr/1391.
2 Organisation for Economic Co-operation and Development, Revenue Statistics, 1965–2004, 2005.
3 Christophe Grandcolas, “VAT in the Pacific Islands,” Asia-Pacific Tax Bulletin, January/February 2004. Available at http://unpan1.un.org/intradoc/groups/public/documents/UNPAN/UNPAN014879.pdf.
4 Chris Atkins, “In OECD Comparison of Wage Taxes, US Ranking Would Slip Badly if 2001 Tax Cuts Expired,” Fiscal Facts No. 89, Tax Foundation, July 9, 2007. Available at http://www.taxfoundation.org/publications/show/22469.html.
5 Chris Atkins and Scott Hodge, “The US Corporate Income Tax System: Once a World Leader, Now a Millstone Around the Neck of American Business,” Special Report No. 136, Tax Foundation, November 2005. Available at http://www.taxfoundation.org/files/sr136.pdf.
7 Ministry of Finance, Iceland, “Principal Tax Rates,” July 2006. Available at http://eng.fjarmalaraduneyti.is/media/Taxes/Principal_tax_rates_2006.pdf.
9 Daniel Mitchell, “Eastern Europe’s Flat Tax Revolution,” Tax Notes International, March 14, 2005.
10 Karl Ritter, “Sweden plans to scrap decades-old wealth tax in move to stay competitive,” Canadian Press, March 30, 2007. Available at http://www.canada.com/topics/news/world/story.html?id=1ee13bf1-0462-4a5b-978c-3782667 e1eb3&k=87435.
11 Richard Herd and Thorsteinn Thorgeirsson, “Increasing Simplicity, Neutrality, and Sustainability: A Basis for Tax Reform in Iceland,” Economics Department Working Papers, No. 292, May 3, 2001. Available at http://www.oecd.org/dataoecd/32/3/1891991.pdf.
12 Statistics Iceland, “General Government Finances 1998-2006,” March 30, 2007. Available at http://www.statice.is/lisalib/getfile.aspx?ItemID=6216.
13 International Monetary Fund, “World Economic Outlook Databases,” September 2006. Available at http://www.imf.org/external/ns/cs.aspx?id=28.
15 U.S. Social Security Administration, “International Update: Recent Developments in Foreign Public and Private Pensions,” March 2007. Available at http://www.ssa.gov/policy/docs/progdesc/intl_update/2007-03/2007-03.html.
16 U.S. Social Security Administration, “Social Security Programs Throughout the World: Europe 2006” Office of Policy, September 2006. Iceland data available at http://www.ssa.gov/policy/docs/progdesc/ssptw/2006-2007/europe/iceland.pdf.
17 Organisation for Economic Cooperation and Development, “Economic Survey of Iceland, 2006,” Policy Brief, July 2006. Available at http://www.oecd.org/dataoecd/22/45/37215813.pdf.
18 Iceland Prime Minister’s Office, “Iceland’s privatisation programme 1991-2000,” October 30, 2001. Available at http://eng.forsaetisraduneyti.is/ministry/Privatisation/nr/310.
19 Hannes Gissurason, Overfishing: The Icelandic Solution, Institute of Economic Affairs, September 2000, http://www.iea.org.uk/record.jsp?type=book&ID=16.
20 Organisation for Economic Cooperation and Development, “Economic Survey of Iceland, 2006,” Policy Brief, July 2006. Available at http://www.oecd.org/dataoecd/22/45/37215813.pdf.
21 Organisation for Economic Cooperation and Development, “OECD in Figures, 2006-2007,” January 2007. Available at http://www.oecdobserver.org/news/printpage.php/aid/1988/OECD_in_Figures_2006-2007.ht ml.
22 International Monetary Fund, “Iceland: 2006 Article IV Consultation—Staff Report; Staff Statement; and Public Information Notice on the Executive Board Discussion,” IMF Country Report No. 06/296, August 2006. Available at http://www.imf.org/external/pubs/ft/scr/2006/cr06296.pdf.
23 World Economic Forum, “Global Competitiveness Report 2006-2007,” September 2006. Available at http://www.weforum.org/pdf/Global_Competitiveness_Reports/Reports/gcr_2006/gcr2006_r ankings.pdf.
24 International Institute for Management Development,”The World Competitiveness Scoreboard,” 2006. Available at http://www02.imd.ch/documents/wcc/content/overallgraph.pdf.
25 Forbes, “Capital Hospitality,” Special Report, April 3, 2007. Available at http://www.forbes.com/lists/2007/6/07caphosp_Capital-Hospitality_Rank.html.
26 Economic Freedom of the World, “Chapter 1: Economic Freedom of the World, 2004,Annual Report, 2006” Available at http://www.freetheworld.com/2006/1EFW2006ch1.pdf.
27 Timothy Kane Ph.D., Kim R. Holmes, Mary Anastasia O’Grady, 2007 Index of Economic Freedom (Washington, D.C.: The Heritage Foundation and Dow Jones & Company, Inc., 2007). Available at http://www.heritage.org/research/features/index/country.cfm?id=Iceland.
28 Organisation for Economic Cooperation and Development, Economic Outlook 80 database, available at http://www.oecd.org/dataoecd/5/51/2483816.xls.
29 International Monetary Fund, “Iceland: 2006 Article IV Consultation—Staff Report; Staff Statement; and Public Information Notice on the Executive Board Discussion,” IMF Country Report No. 06/296, August 2006. Available at http://www.imf.org/external/pubs/ft/scr/2006/cr06296.pdf.
30 Organisation for Economic Cooperation and Development, “Economic Survey of Iceland, 2006,” Policy Brief, July 2006. Available at http://www.oecd.org/dataoecd/22/45/37215813.pdf.
31 Compared to other Nordic nations, Iceland is more likely to means-test benefits.
32 Romina Boarini, Asa Johansson, and Marco Mira d’Ercole, “Alternative Measures of Well-Being,” Social, Employment and Migration Working Paper No. 33, Organization for Economic Cooperation and Development, February 17, 2006. Available at http://www.oecd.org/dataoecd/13/38/36165332.pdf.
33 Finance Ministry of Denmark, “Svar pa sporgsmal nr. S 332 til finansministerer af 16. marts 2005 stillet af Peter Christensen (V),” April 4, 2005. Available at http://www.folketinget.dk/samling/20042/spoergsmaal/S332/svar/endeligt/20050407/156410.P DF. http://www.olis.oecd.org/olis/2006doc.nsf/43bb6130e5e86e5fc12569fa005d004c/407e59fce61a cd81c125710d003d6c67/$FILE/JT00200315.PDF.


