November 2009, Vol. IX, Issue II
Government-Run Health Care Means
Higher Deficits and Debt:
Realistic Assumptions Show 10-Year Deficits
Easily Could Exceed $600 Billion
The healthcare proposals in the House and Senate are bad news for taxpayers and would permanently damage the American economy with more spending, taxes, and debt. While the details differ, both plans add about $1 trillion to the burden of federal spending over the next 10 years according to congressional estimates. Some of this spending is financed with higher taxes, and both plans also promise to finance a portion of the new spending by curtailing the growth of other programs, particularly Medicare.
Supporters of a government take over of health care argue this approach is fiscally responsible because the higher taxes and promises of future spending restraint supposedly exceed the amount of proposed new spending. Making government bigger, however, is not fiscally prudent – especially when the estimates put together by the congressional forecasters are deeply flawed.
In reality, the proposals on Capitol Hill will make government more expensive and increase deficits. Government programs almost always cost more than the preliminary estimates, and projections for healthcare spending have been notoriously inaccurate. Moreover, tax increases will not collect as much revenue as politicians want because of “Laffer Curve” effects. Last but not least, the promised spending restraint is a farce. If congressional forecasts are modified to be more realistic, deficits and debt will climb by at least $600 billion – and perhaps more than $850 billion – over the next 10 years.
By Daniel J. Mitchell, Ph.D.
Key Observations
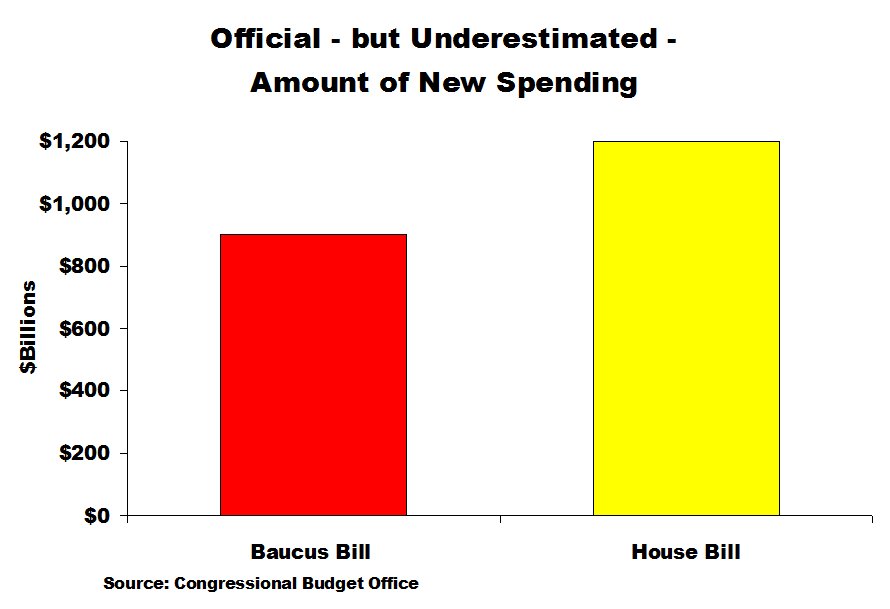
- The Senate plan would increase the burden of federal spending by nearly $900 billion, while the House legislation would increase government by nearly $1.3 trillion according to the Congressional Budget Office.
- These estimates are far too low because they do not properly measure how people and businesses change their behavior in response to government handouts.
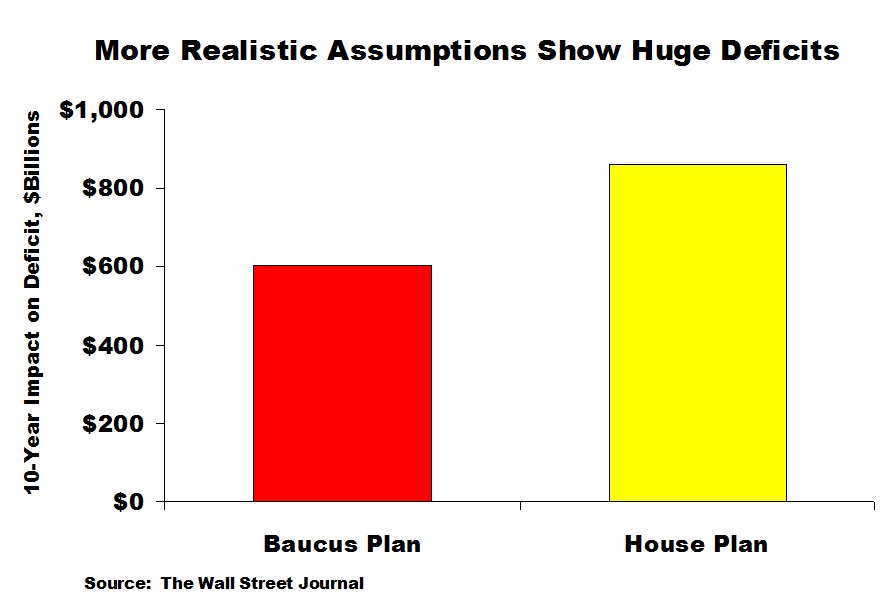
- Even tiny errors in forecasts from the Congressional Budget Office (CBO) and Joint Committee on Taxation (JCT) have enormous fiscal implications. If revenues and offsets are 25 percent below the forecast and spending is 50 percent higher than estimated (and that almost surely is still too optimistic), the 10-year deficits will be $602 billion to $860 billion higher.
- There are significant incentives for companies to dump their healthcare plans since workers will then get more take-home pay and be able to obtain health insurance using subsides and handouts from the government. This will dramatically increase budgetary costs.
- The spending estimates also are far too low because they do not recognize that politicians in the future will be tempted to expand subsidies as part of routine vote-buying behavior, similar to what happened with Medicare and Medicaid.
- The estimated savings are especially implausible since many details about the legislation are still unknown.
- ·The cost of the proposals is disguised since the new spending is backloaded. More than 90 percent of spending in the Senate plan and 84 percent of spending in the House plan takes place in the second five years of the 10-year scoring estimate.
- ·Even the savings that might be real in the Senate plan, such as reductions in Medicare payment rates for physicians’ services, are pushed off into the future, where they can be canceled by politicians seeking to curry favor with key constituencies.
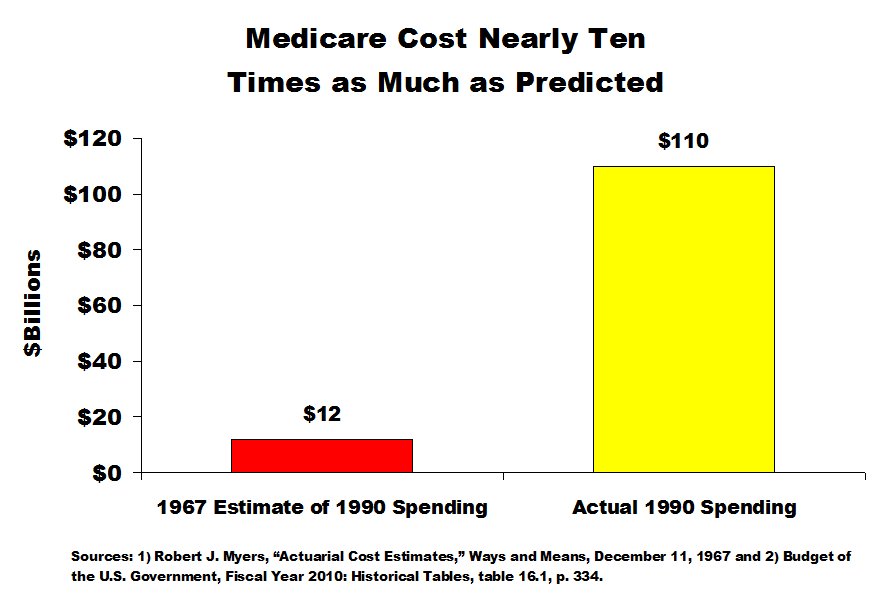
- The federal government’s ability to predict healthcare spending leaves much to be desired. When Medicare was created in 1965, the long-run forecasts estimated that the program would cost about $12 billion by 1990. In reality, it cost more than $100 billion that year (and now costs $500 billion).
- Medicaid was also created in 1965 and was supposed to be a very small program with annual expenditures of about $1 billion. It has now become a huge $250 billion entitlement – and that’s just the cost to federal taxpayers.
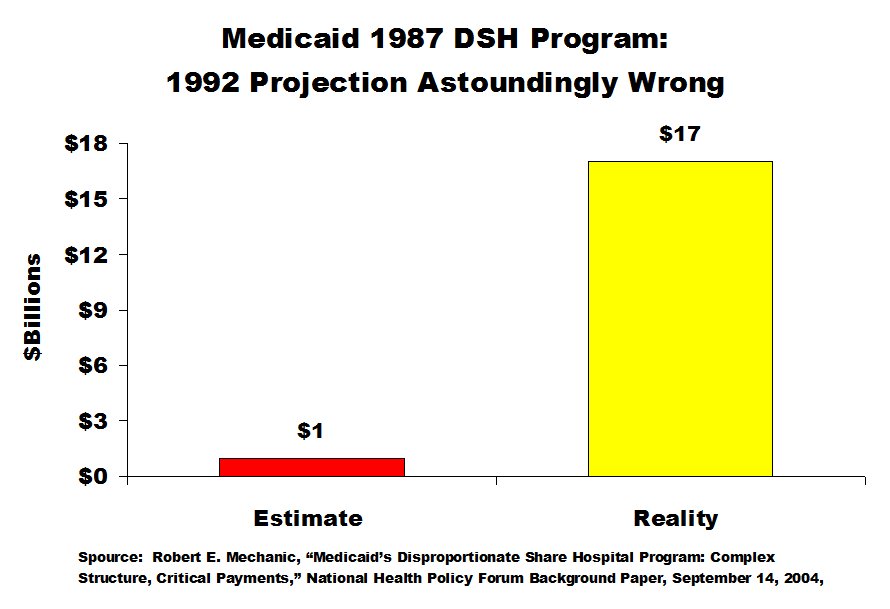
- Medicaid’s disproportionate share hospital (DSH) program is a sobering example. Created in 1987 to subsidize hospitals with large numbers of Medicaid and uninsured patients, the programs was supposed to cost less than $1 billion in 1992, but the actual cost that year was a staggering $17 billion.
- The Medicare Catastrophic Coverage legislation was adopted in 1988 and then repealed less than two years later, in part because some provisions were already projected to cost six times more than originally forecast.
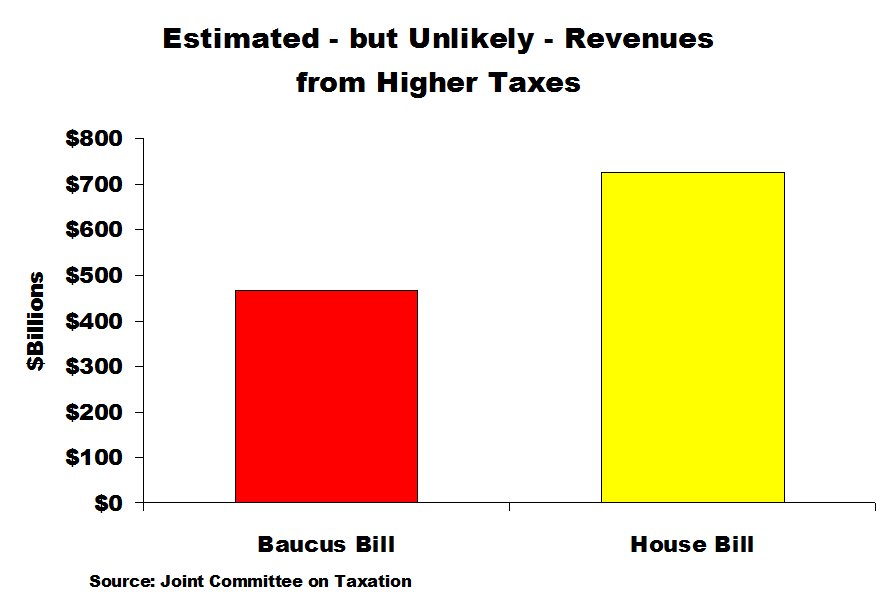
- The tax provisions in the healthcare proposals will impose considerable damage without raising much revenue. The House legislation supposedly raises more than $460 billion with higher income tax rates, but actual collections would be far smaller because of reduced incentives to earn income and increased incentives to avoid and evade taxes.
- The Senate plan has big tax increases on high-cost insurance policies, medical devices, and health insurance providers, but a substantial share of the projected revenue will evaporate as businesses and consumers alter their behavior to protect themselves from the tax.
- Both plans hide the actual tax burden by counting “penalty fees” on individuals and companies as negative spending, which is a nontrivial issue, particularly for the House plan, with has nearly $170 billion of these hidden taxes.
- Thanks to the phase-out of insurance subsidies, taxpayers with modest incomes will face marginal tax rates of nearly 70 percent, a staggering penalty on upward mobility that will hinder overall economic performance.
- Deficits and debt will skyrocket under both plans. Big increases in government spending and higher taxes are a poisonous combination that will slow growth and expand government even further.
- To add insult to injury, the internal revenue service would get new enforcement powers to determine if people have acceptable (in the eyes of politicians and bureaucrats) health insurance.
Introduction
The political tangling over “Obamacare” is a bit of a misnomer since there is no official plan from the White House. The Administration has deliberately – some say cleverly, others say evasively – avoided specifics and instead focused on vague themes such as a desire for universal coverage and support for government run insurance to “compete” with private health insurers (much as Fannie Mae and Freddie Mac “competed” with private financial institutions).
But even those items are negotiable. The White House has signaled that the President will sign just about any bill Congress enacts. Based on the proposals in the House and Senate, this is troubling news for taxpayers. The federal government has a record of waste and abuse with new entitlement programs. Medicare and Medicaid, both of which are models for proposed government run insurance, were both far more expensive than first predicted. Moreover, a larger public sector will divert resources from the productive sector of the economy, further undermining prosperity. The combination of a growing government and a sputtering private sector is a recipe for more deficits and more debt.
The House and Senate Plans Mean Much Bigger Government According to Official Estimates
The proposals being considered by the House1 and Senate2 are both designed to expand health insurance through a costly carrot-and-stick approach. Subsidies are used to artificially reduce the cost of obtaining insurance, and various mandates, taxes, penalties, and fees are used to prod consumers (or their employers) into providing insurance.3
From a fiscal perspective, the subsidies are the biggest parts of both proposals. As shown Figure 4, the Senate proposal includes nearly $900 billion of subsidies and spending over the next 10 years (2010-2019) according to the official estimates of the Congressional Budget Office,4 while the House bill is even more extravagant, with CBO estimating close to $1.3trillion of subsidies.5
Both proposals have “offsets” that supposedly finance some or all of this new spending. The offsets can be divided into two categories – tax increases and promises of spending restraint. The tax increases in the two proposals are significantly different, both in content and magnitude. The lion’s share of the revenue in the House bill, at least according to estimates from the Joint Committee on Taxation, will be generated by higher tax rates on investors, entrepreneurs, and other upper-income taxpayers.6 JCT predicts the biggest source of new revenue in the Senate proposal, meanwhile, is a big tax increase on health insurance policies above a certain cost.7 As seen in Figure 5, the House bill has a larger overall tax increase. And although this does not change the amount of money going to Washington, taxpayers presumably will not be happy that the internal revenue service is going to be the chief enforcement agency for determining if people have the appropriate (as defined by the crowd in Washington) health insurance policy.8
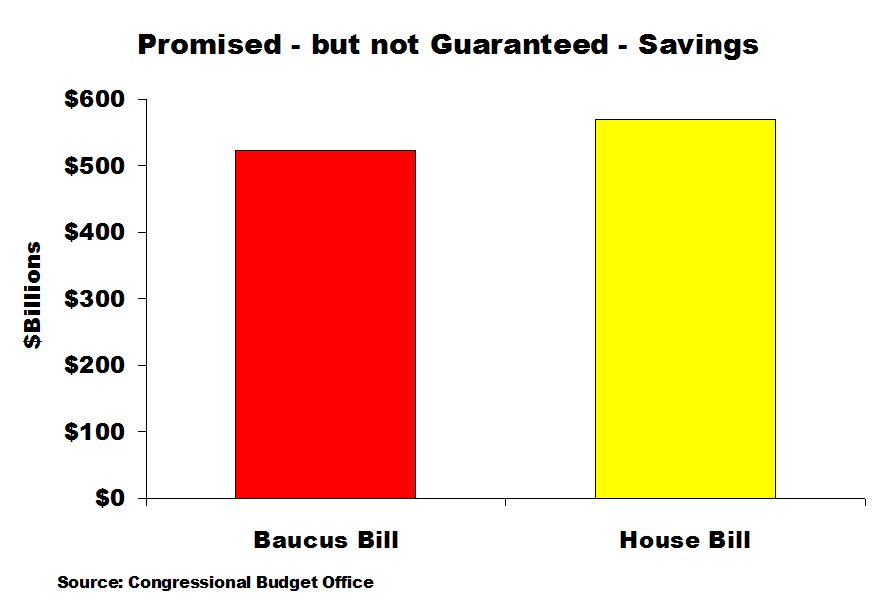
The other offsets in the two proposals are various initiatives to curtail the rapid rise in spending for Medicare9 (there also are savings from Medicaid,10 but a significant share of the new spending is funneled through that program, so the overall Medicare budget becomes even bigger). These provisions in the House and Senate proposals often are characterized as “cuts,” but that is disingenuous. Under current law, Medicare is expected to climb from about $500 billion to nearly $950 billion over the next 10 years. Federal spending on Medicaid, meanwhile, is projected to jump from less than $300 billion to more than $425 billion during the same period.11 The so-called cuts in the two proposals merely trim how fast the budgets grow for these two programs. But this may be a meaningless discussion since no actual savings are guaranteed. With that caveat in mind, Figure 6 compares the ostensible savings in the two proposals.
Even though the size and cost of government are the key variables, the debate in Washington about major pieces of legislation often revolves around the impact on government borrowing. This supposedly is good news for advocates of government-run health care. If one believes the official estimates, the proposal produced by the Senate Finance Committee will reduce cumulative budget deficits by $81 billion over the next 10 years. The House legislation, meanwhile, will reduce 10-year budget deficits by $104 billion according to the scorekeepers employed by Congress.
Reality: A Fiscal Time Bomb Waiting to Explode
These estimates, though, are deeply flawed. The methodology – and track records – of both CBO and JCT leave much to be desired. Government estimators routinely fail to capture the degree to which people change their behavior to access money and services from the government, and they also fail to measure the degree to which people change their behavior to protect themselves (or their businesses) from changes in tax policy. Economic analysis and historical experience both suggest that spending will be higher than CBO estimates and tax collections will be lower than JCT estimates. Expanding government’s role in healthcare therefore is a path to much higher budget deficits.
Why the Congressional Budget Office is Under-Estimating Spending
Despite the track record of waste in Washington, the CBO assumes that these bills will not result in abuse and overspending. Yet people generally try to maximize their living standards, so when government offers a new set of subsidies and handouts, most people will endeavor to get “their share” of the loot that they are “entitled” to receive under the new program. Moreover, other people will alter their circumstances – legally or illegally – so that they also can benefit from the largesse. The CBO theoretically tries to measure these “microeconomic” responses, but history indicates that the bureaucracy does not do a good job.
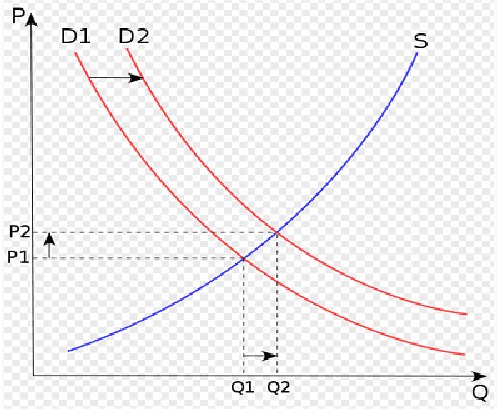
In addition, the forecasters do not seem to have a proper understanding of how expanded insurance will increase demand for healthcare, particularly in a system where insurance is not reserved for unexpected and catastrophic expenses and instead is also used for routine medical costs. Health experts frequently grouse about significant expenditures for unnecessary care, but consumers have little reason to self-ration and shop carefully when that the marginal out-of-pocket costs of visits to the doctor or hospital are artificially low because of insurance (the infamous “third-party payer” problem). It is akin to going to an all-you-can-eat restaurant, but with the perception that someone else is paying the bill – meaning people over-consume and do not care much about cost. Similarly, the forecasters at CBO do not fully measure how insurance providers will respond. If the government implements big subsidies for the purchase of health insurance, this will increase the demand for policies, and even a first-year economic student can explain that this will lead to higher prices. This is illustrated in Figure 7, which shows an increase in demand (D1 to D2), which results in higher prices (P1 to P2).
Consider a hypothetical example of what would happen if government started subsidizing the purchase of other products, such as golf clubs or dog food. Instinctively, we understand that producers would raise prices to take advantage of the additional demand. Or consider a real-world example. Fannie Mae and Freddie Mac were government-created entities designed to make mortgage financing more affordable. Along with other subsidies, this understandably increased the demand for housing, and housing prices rose (too far, but that’s a separate issue). The same thing will happen with health insurance.
The House and Senate plans also will drive up the cost of insurance because of provisions that require similar premiums, regardless of whether people are healthy or sick. Known as “guaranteed issue” and “community rating,” these provisions will increases insurance coverage for people with high medical costs, but there is no escaping the fact that this will push up overall premiums.12 For these and other reasons, a major accounting firm estimated that health insurance costs for the average American family will rise dramatically. Specifically:
This analysis shows that the cost of the average family coverage is approximately $12,300 today and could be expected to increase to approximately: $15,500 in 2013 under current law and to $17,200 if these provisions are implemented. $18,400 in 2016 under current law and to $21,300 if these provisions are implemented. $21,900 in 2019 under current law and to $25,900 if these provisions are implemented.13
The CBO numbers also are deeply flawed because there is little (if any) recognition of the incentive that has been created for employers to dump their employee health plans. Most firms view these plans as a hassle, but they offer plans because workers benefit from getting as much compensation as possible in the form of untaxed fringe benefits. But the benefit of those tax breaks for many workers will be less than the value of the handouts and subsidies the government will be offering. In such an environment, the workers will be happy to lose their employer-provided coverage. This is because the money they receive (more take-home pay and big subsidies from the government will be greater than the costs (any tax on the take-home pay plus out-of-pocket costs for health insurance). This is particularly true for the growing share of the population – 47 percent according to recent estimates – that is exempt from the income tax already.14
Another problem is that the CBO numbers don’t measure the extent to which costs are hidden in future years. This occurs when lawmakers delay the implementation of certain provisions to create an artificially low estimate. This “backloading” gimmick is happening with the House and Senate plans. More than 90 percent of the spending in the Senate plan taking place in the second five years of the 10-year scoring estimate, and more than 84 percent of the spending in the House plan also in the last five years. Michael Tanner of the Cato Institute elaborates:
The CBO provides 10- year projections of a bill’s cost. But most provisions of the health bill don’t take effect until 2014. So the “10-year” cost projection only includes six years of the bill. Plus, the costs ramp up slowly. In its first year, the House bill would only cost about $6 billion; in its first three, less than $100 billion. The big costs are in the final years of the 10-year budget window — and beyond. In fact, over the first 10 years that the House bill would be in existence (2014 to 2024), its costs would be closer to $2.4 trillion. Similarly, the real cost of the Senate bill over 10 years of operation is estimated at $1.5 trillion.15
Tanner also explains that the long-term unfunded liability, at least for the House legislation, is more than $9 trillion.16 That is a lot of money, even in Washington.
Last but not least, the official budget estimates from CBO fail (albeit more understandably) to anticipate changes in political behavior. Simply stated, it is inconceivable that politicians in the future will resist the temptation to increase benefits and expand eligibility. This is particularly true since it would be just a matter of time before the media started reporting about the share of the population that still lacked insurance, or gave coverage to hardship examples of people that could not afford insurance even with all the subsidies and handouts.
Why the Joint Committee on Taxation is Over-Estimating Revenues
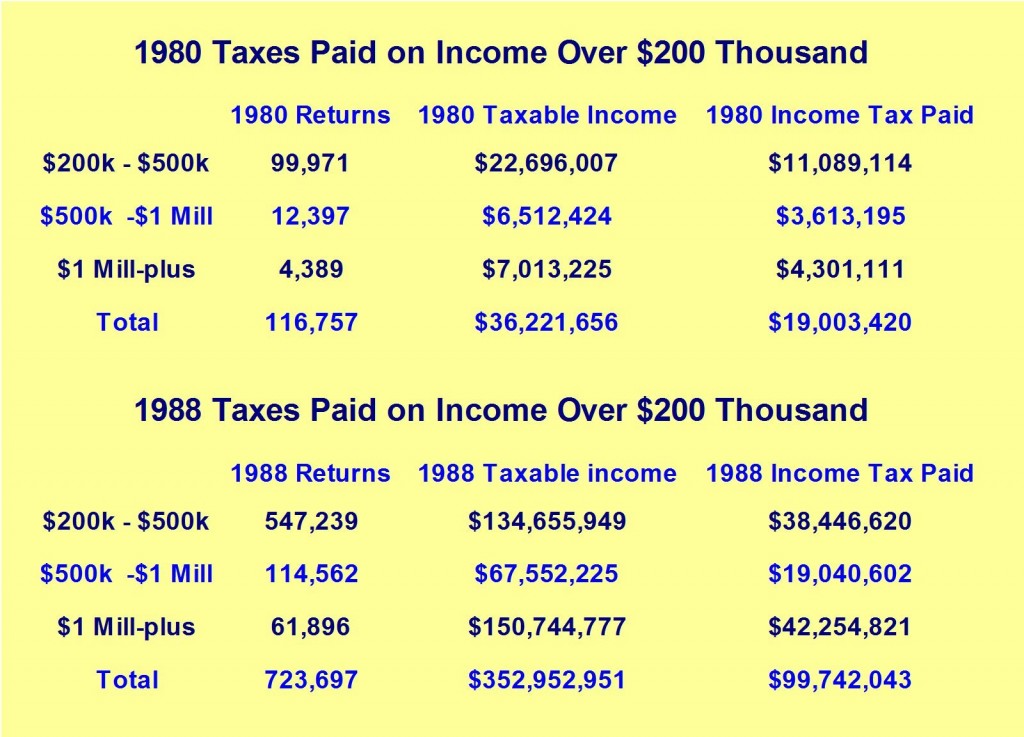
Taxes discourage people from engaging in the actions that result in tax. Politicians frequently raise taxes on tobacco, for instance, because they want to discourage smoking. Setting aside whether government should try to control people’s private lives, the politicians care correct – at least in the narrow sense that higher tobacco taxes will discourage smoking. But that also means that there will be fewer cigarettes to tax, and therefore less money for government (or at least not as much additional money as would be the case if tobacco consumption did not change). Almost all taxes generate behavioral responses. Upper-income people, for instance, earned and reported far more income after the Reagan tax cuts. The response was so large that the IRS actually collected five times more money from the “rich” in 1988 (when the top tax rate was 28 percent) than it did in 1980 (when the top tax rate was 70 percent).17
The tax provisions in the healthcare proposals on Capitol Hill will generate similar behavioral responses. The higher income tax rates in the House bill will discourage investors, entrepreneurs, and other upper-income taxpayers from working, saving, and investing. This means they will earn less taxable income. Moreover, the higher tax rates will encourage tax avoidance and tax evasion, which means they will report less taxable income. The combination of these factors will result in far less than the $460.5 billion that JCT is projecting for that provision.18 The same is true for the other JCT estimates (as well as CBO’s estimates for the amount of revenue that will be generated by hidden taxes such as “play-or-pay” fees for employers and mandates for individuals).19
|
The revenue estimates for the Senate plan are equally unrealistic. The biggest share of revenue, $201.4 billion, supposedly will come for a 40 percent excise tax on the value of expensive insurance plans.20 To be fair, JCT tries to measure the extent to which businesses and workers will shift to lower-cost health plans, but it is very doubtful this provision will collect anywhere close to $200 billion. And since CBO assumes that revenues from this provision will grow by more than 10 percent annually even past the 10-year budget window, there clearly is insufficient attention to how people will respond to avoid the huge tax. The same is true of the steep taxes on medical devices and insurance providers. Clearly there will be behavioral responses, yet there are not properly reflected in the revenue estimates.
Why the Congressional Budget Office is Over-Estimating Spending Offsets
The House and Senate proposals both promise to finance (or offset) some of the subsidies and handouts by curtailing the growth of other government health programs – particularly Medicare. Since Medicare is projected to nearly double over the next ten years, from $500 billion to $950 billion, reducing the program’s growth rate is a worthy endeavor. Unfortunately, the supposed offsets are either gimmicks or dubious promises to be more frugal in the future.
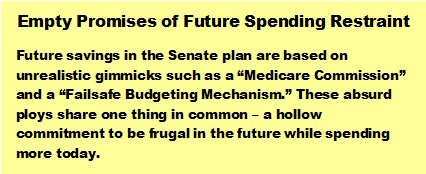
The Senate plan, for instance, pretends to save money, but that is in part because it uses gimmicks without any actual guarantees of savings. The two main ploys are a “Medicare Commission” and a “Failsafe Budget Mechanism.” Both are based on the fatuous notion that politicians will meekly stand aside and let bureaucrats and/or formulas make changes to programs to keep spending from climbing too rapidly. Yet the last 45 years have shown that politicians do precisely the opposite. They routinely seek to expand benefits and increase eligibility in order to buy votes from various interest groups.
There are some non-gimmicky provisions in the House and Senate plans, but they are extremely improbable. Are politicians really going to start reducing subsidies to hospitals beginning in 2014? Are they really going to cut physician reimbursements – but only in the future, and notwithstanding that Congress has rejected such savings every year since 2003?21 The only realistic offset is the evisceration of the Medicare Advantage plan, which is being targeted by some in Washington for ideological reasons because it gives senior citizens some degree of control and allows them to choose among competing health plans.
Finally, the official “scoring” of the proposals do not count the enormous costs imposed on consumers. Forcing individuals to purchase health insurance is essentially the same as taxing them – and such mandates were considered a tax by the congressional estimators in the early 1990s when the Clinton Administration sought to impose a government-run system. Now the politicians have used clever legislative language to dodge this issue, but that doesn’t mean the costs are no longer there.
The Cumulative Negative Impact of Bigger Government and Higher Taxes
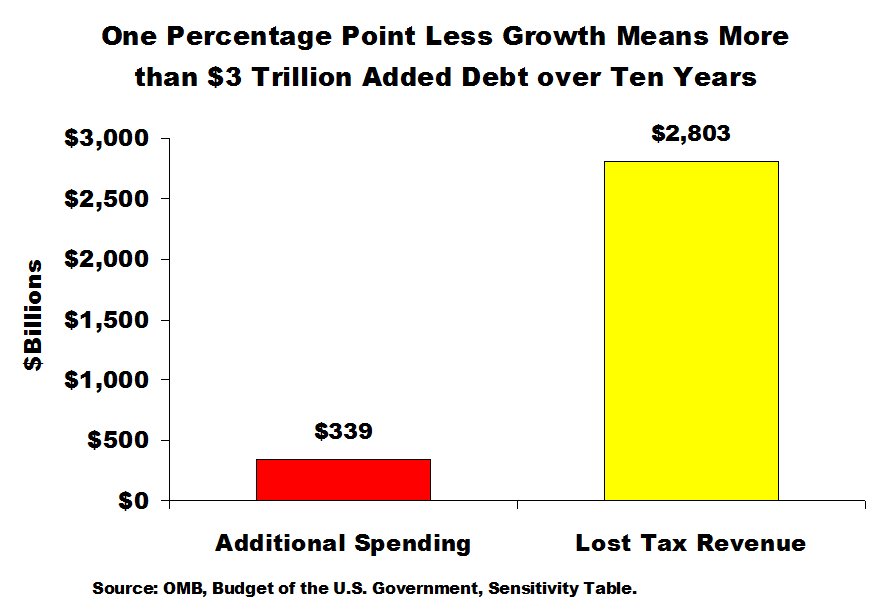
Neither the JCT nor the CBO even try to measure the impact of fiscal policy on the overall economy. Yet academic research shows that a rising burden of government will reduce economic growth. And since even small changes in economic growth can have a big impact on taxable income over time (and also impact eligibility for government programs), this should be a critical component of any accurate revenue estimate. As shown in Figure 8, the Obama Administration estimates that the 10-year deficit would jump by a staggering 3.14 trillion if economic growth is one percentage point less each year.
There also are other effects that make the estimates very unreliable. As explained earlier in the paper, much of the new spending in the proposals is to subsidize insurance coverage. But the subsidies are not universal. In order to limit handouts to those with more modest incomes, the subsidy is gradually withdrawn as household income increases. That sounds reasonable, and it does help control spending, but it has the unintended effect of increasing the effective marginal tax rate on a wide range of people. As Greg Mankiw of Harvard University explains:
…a family of four making $54,000 would pay $4,800 for health insurance. The rest of the premium would come from government subsidies. If the family’s income rises to $66,000, the subsidy falls, and the cost of health insurance rises to $7,600. In other words, earning an additional $12,000 requires the family to pay an additional $2,800. The implicit marginal tax rate is $2,800/$12,000, or 23 percent. Similarly, a single person earning $26,500 would pay $2,300 for health insurance, but if his income rises to $32,400, his premium rises to $3,700. This yields an implicit marginal rate of 24 percent. You get somewhat different numbers at other income levels. Typically, however, the implicit marginal tax rates are around 20 percent. Those figures for marginal tax rates are, of course, added on top of those already imposed by existing income and payroll taxes.22
The higher implicit marginal tax rates are very substantial in both House and Senate proposals, and they will discourage productive activity. Indeed, some middle-income taxpayers will face effective marginal tax rates of nearly 70 percent – which was the highest statutory tax rate that existed for the wealthy when Ronald Reagan took office. The failure to measure the impact of these higher tax rates is a major failure of the estimating process. More important, it is yet another reason why spending will be higher, tax receipts will be lower, future generations will be saddled with greater debt and deficits will be bigger if government-run healthcare is enacted.
Historical Evidence Shows Government Programs Cost More than Predicted
There are ample reasons to be very skeptical about the fiscal estimates produced by the CBO and JCT. Congressional forecasters are good at building elaborate models, but those efforts do not yield useful information since the models fail to reflect how individuals in the real world respond to changing incentives. Simply stated, CBO and JCT have always failed to correctly measure behavioral responses. A look at past episodes shows how the forecasts are routinely way off the mark.
Congressional Estimators Routinely Underestimate Cost of Health Care Programs
The bureaucrats who estimate the budgetary effects of tax and spending proposals have a track record of misleading the public. For more than forty years, government officials have consistently underestimated how much programs cost and routinely overestimated how much revenue will be collected by higher taxes. Here are a few of the more dramatic examples:
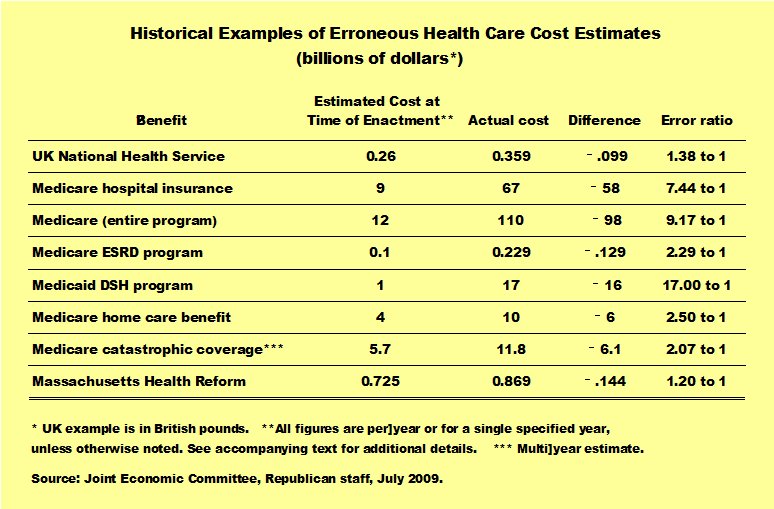
- When Medicare was created in the mid-l960s, actuaries projected the program’s hospital insurance budget would reach $9 billion by 1990.23 The actual 1990 cost was $67 billion.24
- The long-run forecasts estimated that the entire Medicare program would cost about $12 billion by 1990.25 In reality, it cost more than $100 billion that year (and now costs $500 billion).26
- Medicaid was also created in 1965 and was supposed to be a very small program with annual expenditures of about $1 billion.27 It has now become a huge $250 billion entitlement.
- Medicaid’s disproportionate share hospital (DSH) program is a sobering example. Created in 1987 to subsidize hospitals with large numbers of Medicaid and uninsured patients, the programs was supposed to cost less than $1 billion in 1992, but the actual cost that year was a staggering $17 billion.28
- The Medicare Catastrophic Coverage legislation was adopted in 1988 and then repealed less than two years later, in part because some provision were already projected to cost six times more than forecast.29
The accompanying table, prepared by the Joint Economic Committee, using state, national, and international examples, shows that there is a pervasive pattern of government health programs being more expensive than indicated by forecasts. Needless to say, there is rarely if ever pressure to correct the mistakes. Instead, taxpayers get saddled with higher deficits and more debt.
The Medicare Prescription Drug Program: The Exception that Proves the Rule
While CBO almost always is guilty of underestimating costs, there is one notable exception. When the bureaucrats estimated the cost of the prescription drug program in 2003, they overestimated how much the program would cost.30 Since the program is still only a few years old (the benefits generally did not begin until 2006), it would be unwise to draw too many sweeping conclusions, but the Trustees of the program report that forecasters erred in their predictions about drug prices.
So while it is good news that a program actually wound up costing less than initially projected, it was because of a specific (and rather substantial) error about a unique parameter – the price of pharmaceuticals. If anything this is further proof of dangerously sloppy budget projections in Washington. There is little reason to think that CBO has suddenly become more accurate about the broader challenges of assessing how people respond to incentives and measuring the impact of taxes and spending on economic performance.
It’s Not Just a Healthcare Problem
The failure to properly estimate costs is not limited to healthcare programs. Government programs of all kinds usually cost more than the initial cost estimates. This is true for military contract, road projects, agriculture subsidies, and other forms of income redistribution.31
Government estimators also have a hard time figuring out how changes in tax policy will affect revenues. This is often because the Joint Committee on Taxation assumes that tax policy changes–regardless of their magnitude–have no impact on the economy’s performance. Revenue estimators assume that the growth rate, job creation, and income will remain unchanged regardless of how much taxes are reduced or increased. As a result, official estimates from JCT commonly overstate both the amount of tax revenue that will be generated by tax increases and the amount of revenue the government will “lose” due to tax rate reductions.
The absurdity of this approach became clear in 1988 when Senator Robert Packwood (R-OR), then ranking Republican on the Finance Committee, asked the JCT to estimate the revenue impact if the government confiscated all income over $200,000 annually. The revenue estimators at JCT responded that such a tax would raise $104 billion the first year, $204 billion the second year, $232 billion the third year, and $263 billion and $299 billion in the fourth and fifth years, respectively.32 Needless to say, this was a nonsensical estimate. As Senator Packwood noted, the JCT’s calculation “assumes people will work if they have to pay all their money to the Government. They will work forever and pay all of the money to the Government when clearly anyone in their right mind will not.”
To cite a real-world example, the lower tax rates implemented during the 1980s resulted in a huge jump in taxable income reported by upper-income taxpayers. As noted in an earlier section of the paper – and as detailed in Table 2, the net result was that the government collected five times as much revenue from the so-called rich.
The Bottom Line
Even tiny errors in forecasts from the Congressional Budget Office and Joint Committee on Taxation have enormous fiscal implications. Devising more realistic estimates would be a daunting exercise, well beyond the scope of this analysis. But consider what happens if the official forecasts are altered to be more realistic. Assume, for instance, that both CBO and JCT have been slightly too optimistic and that spending is 10 percent higher than forecast and that revenues and offsets are 10 percent less than estimated. Even with that trivial change, the predicted 10-year deficit reduction disappears. The Senate plan increases deficits by $183 billion and the House proposal boosts deficits by $258 billion.
But history suggests that the errors will be far larger. If revenues and offsets are 25 percent below the forecast and spending is 50 percent higher than estimated (and that almost surely is still too optimistic), the 10-year deficits will be $602 billion to $860 billion higher. And if the cost is two or three times higher than the forecast, then the deficit (and, more importantly, the size of government) reaches staggering levels.
Conclusion
In every possible way, the government’s forecasters do a dismal job predicting the cost of government programs. The estimators also have a poor track record of predicting the revenue impact of changes in tax policy. This is not necessarily because CBO and JCT are biased, though some suspicion is warranted since spending estimates almost always are too low and tax estimates generally are too high.
Congress controls the pay and employment of the forecasters at CBO and JCT, so the ultimate responsibility belongs on the shoulders of elected officials. Yet it is these officials that want favorable budget scoring to help make legislation more palatable for a skeptical public.
Regardless of whether the problems are due to honest mistakes or “cooked books,” the final result is the same. The budget forecasts for a government take over of health care are grossly optimistic. Spending will be higher than forecasted if a bill is enacted to subsidize health insurance. Tax increases will not generate the amount of forecasted receipts. And budget deficits and debt will grow even more rapidly.
__________________________________
Daniel Mitchell is a Senior Fellow at the Cato Institute (www.cato.org), a free-market think tank located in Washington, DC. He also co-founded the Center for Freedom and Prosperity Foundation and serves as the Chairman of its Board of Directors.
The Center for Freedom and Prosperity Foundation is a public policy, research, and educational organization operating under Section 501(C)(3). It is privately supported, and receives no funds from any government at any level, nor does it perform any government or other contract work. Nothing written here is to be construed as necessarily reflecting the views of the Center for Freedom and Prosperity Foundation or as an attempt to aid or hinder the passage of any bill before Congress.
The Center for Freedom and Prosperity Foundation, the research and educational affiliate of the Center for Freedom and Prosperity (CF&P), can be reached by calling 202-285-0244 or visiting our web site at www.freedomandprosperity.org.
Endnotes
1 A “leadership bill” has been proposed, H.R. 3962, which is a modified version of H.R. 3200, the bill produced earlier this year by the three major committees of jurisdiction.
2 The Senate plan is the proposal put forward by Senator Max Baucus, Democratic Chairman of the Senate Finance Committee.
3 For a detailed look at the provisions of the two proposals, see “A Side by Side Comparison of Major Healthcare Reform Proposals.” The Kaufman Family Foundation. October, 15 2009. http://www.kff.org/healthreform/sidebyside.cfm.
4 CBO scoring of the Senate plan is available in the Letter to Senator Max Baucus, Chairman of the Senate Finance Committee from the Congressional Budget Office to Senator Max Baucus. October 7, 2009. http://www.cbo.gov/ftpdocs/106xx/doc10642/10-7-Baucus_letter.pdf.
5 CBO scoring of the House bill is available in the Letter to Congressman Charles Rangel, Chairman of the House Ways and Means Committee from the Congressional Budget Office. October 29, 2009. http://www.cbo.gov/ftpdocs/106xx/doc10688/hr3962Rangel.pdf.
6 Most of the revenue estimates for the House bill are available in Joint Committee on Taxation, JCX-43-09, “Estimated Revenue Effects Of Possible Modifications To The Revenue Provisions Of H.R. 3962, The “Affordable Health Care For America Act”.” http://www.jct.gov/publications.html?func=startdown&id=3619. Other revenue provisions (ones that are not being called taxes, for inexplicable reasons) can be found in the CBO estimate.
7 Most of the revenue estimates for the Senate plan are available in “Estimated Revenue Effects of the Provisions Contained in Title VI of The America’s Affordable Health Choices Act Of 2009.” Joint Committee on Taxation. http://www.jct.gov/publications.html?func=startdown&id=3590. Other revenue provisions (ones that are not being called taxes, presumably for political reasons) can be found in the CBO estimate.
8 Byron York. “Healthcare Reform Means More Power for the IRS.” The Washington Examiner, September 2, 2009. http://www.washingtonexaminer.com/politics/Health-care-reform-means-more-power-for-the -IRS-56781377.html.
9 Medicare is the federal government’s health program for the elderly.
10 Medicaid the federal government’s health program for the poor, though nursing home care for the elderly is a significant part of the program’s budget.
11 Data available at “Projected Deficits and Surpluses in CBO’s Baseline.” The Congressional Budget Office. http://www.cbo.gov/ftpdocs/105xx/doc10521/budgetprojections.xls.
12 Steven Spruiell. “Obamacare Dissected.” National Review, October, 13 2009. http://article.nationalreview.com/?q=MGVmMjNjNmExMzUyMGZiY2ZiNDgzM2RjMGMxNDgzNmI
13 Keith Hennessey disagrees with the methodology, but agrees that costs for health insurance will rise. See Keith Hennessey. “Higher Premiums and Lower Wages.” October 12, 2009. http://keithhennessey.com/2009/10/12/pwc-study/.
14 Alan Reynolds. “A 10 Million-Person Exaggeration?” Forbes, October 11, 2009. http://www.forbes.com/2009/10/11/cbo-baucus-health-insurance-income-tax-opinions-contri butors-alan-reynolds.html.
15 Michael D. Tanner. “How Congress is Cooking the Books.” September 30, 2009. The New York Post, http://www.cato.org/pub_display.php?pub_id=10591
17 Daniel J. Mitchell, “The Laffer Curve: Understanding the Relationship Between Tax Rates, Taxable Income, and Tax Revenue,” Center for Freedom and Prosperity Foundation Prosperitas, August 2009. http://www.freedomandprosperity.org/Papers/laffer1/laffer1.shtml
18 Joint Committee on Taxation, JCX-43-09, “Estimated Revenue Effects Of Possible Modifications To The Revenue Provisions Of H.R. 3962, The “Affordable Health Care For America Act”.” The Joint Committee on Taxation. http://www.jct.gov/publications.html?func=startdown&id=3619.
20 Joint Committee on Taxation, JCX-41-09, Estimated Revenue Effects Of The Revenue Provisions Contained In Title VI Of The “America’s Healthy Future Act Of 2009,” As Amended Through October 2, 2009, And Under Consideration By The Committee On Finance, (October 08, 2009). Available at http://www.jct.gov/publications.html?func=startdown&id=3590.
21 Michael F. Cannon. “Max’s budget-gimmick magic.” The New York Post. October 13, 2009. http://www.nypost.com/p/news/opinion/opedcolumnists/max_budget_gimmick_magic_P0Yk0 5WHnje84Sqvnf9FKI
22 Greg Mankiw. Marginal Tax Rates from Health Reform. October 10, 2009. http://gregmankiw.blogspot.com/2009/10/marginal-tax-rates-from-health-reform.html
23 Robert J. Myers, “Actuarial Cost Estimates and Summary of Provisions of the Old-Age, Survivors, and Disability Insurance System as Modified by the Social Security Amendments of 1965, and Actuarial Cost Estimates and Summary of Provisions of the Hospital Insurance and Supplementary Medical Insurance Systems Established by such Act,” Committee Print, Committee on Ways and Means, House of Representatives, 89th Congress, 1st Session; July 30, 1965, Table 11, p. 33.
24 1993 Annual Report of the Board of Trustees of the Federal Hospital Insurance Trust Fund, Table I.C.2, p. 10.
25 Robert J. Myers, “Actuarial Cost Estimates for the Old-Age, Survivors, Disability, and Health Insurance System as Modified by the Social Security Amendments of 1967,” Committee Print, Committee on Ways and Means, House of Representatives, 90th Congress, 1st Session; December 11, 1967.
26 Budget of the U.S. Government, Fiscal Year 2010: Historical Tables, table 16.1, p. 334.
27 Clay Chandler, “Health Care Costs a Long-Term Headache; Economists Fear New Entitlements Would Become a Budget Buster,” The Washington Post, October 17, 1993.
28 Robert E. Mechanic, “Medicaid’s Disproportionate Share Hospital Program: Complex Structure, Critical Payments,” National Health Policy Forum Background Paper, September 14, 2004, p. 4. In 1991, Congress began a process-still on-going-of reforming Medicaid to close loopholes.
29 Marilyn Moon, “The Rise and Fall of the Medicare Catastrophic Coverage Act,” National Tax Journal, Vol 43, no 3, September 1990.
30 2006 Annual Report of the Board of Trustees of the Federal Hospital Insurance and Federal Supplementary Medical Insurance Trust Funds. http://www.cms.hhs.gov/reportstrustfunds/downloads/tr2006.pdf
31 Chris Edwards. “Government Cost Overruns.” March 2009. http://www.downsizinggovernment.org/government-cost-overruns
32 Letter to Senator Robert Packwood from Joint Committee on Taxation, November 15, 1988. For more information, see http://www.heritage.org/Research/Taxes/BG1544.cfm.
_______________________________________________
Center for Freedom and Prosperity Foundation
P.O. Box 10882
Alexandria, Virginia 22310-9998
Phone: 202-285-0244
info@freedomandprosperity.org
www.freedomandprosperity.org

